📣The secular decline in rates may not have boosted U.S. fiscal capacity as much as you think, but it definitely has exposed the U.S. Treasury to more interest rate risk. 🧵
based on #BPEA piece brookings.edu/bpea-articles/…
@SVNieuwerburgh @ProfJiang @MindyXiaolan
based on #BPEA piece brookings.edu/bpea-articles/…
@SVNieuwerburgh @ProfJiang @MindyXiaolan
1/in standard models, government debt is fully backed by the collateral, future primary surpluses (S). So, a natural way to assess fiscal capacity is to measure the dollar value today of this stream of future surpluses
2/ Let’s assume for a second that the federal government runs surpluses, spending and tax revenue that are a constant fraction of GDP. The dollar value in 2021 of future S is given by the multiple on a claim to GDP, the steady-state S/Y and 2021 GDP. 

3/ only GDP is risky here and so the claim to GDP is priced using a discount rate that includes a GDP risk premium (unlevered equity premium), roughly the risk premium on stocks issued by firms that have not issued debt.
4/At the end of 2021, this multiple was around 85, according to our estimates, because of low long yields, and low risk premia. As a result, you’d need a steady-state S of 1.16% to rationalize the current debt/output ratio (at the end of 2021) : 1.16%*85=0.99

5/The decline in long rates over the past two decades has boosted this multiple to 85. This multiple means that you can issue 85% extra debt/output per 1% of primary surplus (as fraction of GDP). A high multiple!
6/But that decline in rates only increases fiscal capacity if you’re actually expected to run primary surpluses, and the CBO does not project any surpluses in the next 30 years. CBO projects deficits of 3.19% until 2052.
7/This simple calculation assumes that S's are constant over the business cycle as a fraction of GDP. But S's typically decline as the economy enters a recession. So, this calculation is really too optimistic. The actual PDV of S is smaller, because S is riskier.

8/ We feed in the actual CBO projections for the primary S in the next 30 yrs and for future debt/output in 2052, and simply back out the PDV of all future projected S, assuming that the debt in 2052 is fully backed by primary S accruing after 2052. (generous assumption)
9/ We (generously) assume the Treasury runs steady-state S/Y of 2.16% starting in 2052 (so that the projected debt/output ratio of 185% projected by the CBO for 2052 is fully backed by surpluses)

10/ if you translate projected deficits until 2052 and the S after 2052 back into 2021 dollars, you end up with $12.4 trillion << $22.40 trillion

11/ Treasury earns seigniorage revenue from the convenience yields on U.S . Treasurys. We assume that this revenue is a constant fraction of GDP going forward. That provides another $4 trillion.

12/The secular decline in rates over the past decades has not really boosted fiscal capacity of the US that much, because the US is not projected to run surpluses any time soon, but it has increased the duration of the surpluses, which occur after 2052.

13/ This means that the Treasury is highly exposed to interest rate risk. A 100 bps increase in rates (all else equal) triggers an increase in steady-state S/Y of 2.67% after 2052 (so that higher D/Y in 2052 is fully backed by surpluses).

14/ What accounts for the discrepancy between the market's valuation of U.S. Treasurys and our measure: 3 scenarios: 1/ market anticipates major fiscal correction relative to CBO projections (we're wrong). 2/ market anticipates Japan-style financial repression 3/ market is wrong
15/ what about the argument that the debt can always be rolled over at the risk-free rate? well, in our approach, the debt is risky (i.e., it does not have a zero beta because the tax claim is riskier than the spending claim) and cannot be rolled over at the risk-free rate.
16/ moreover, in a model with risky g, g<<risk-free in every state of the world would generate arbitrage opportunities for private investors borrowing at the risk-free and earning g by loing in equity.
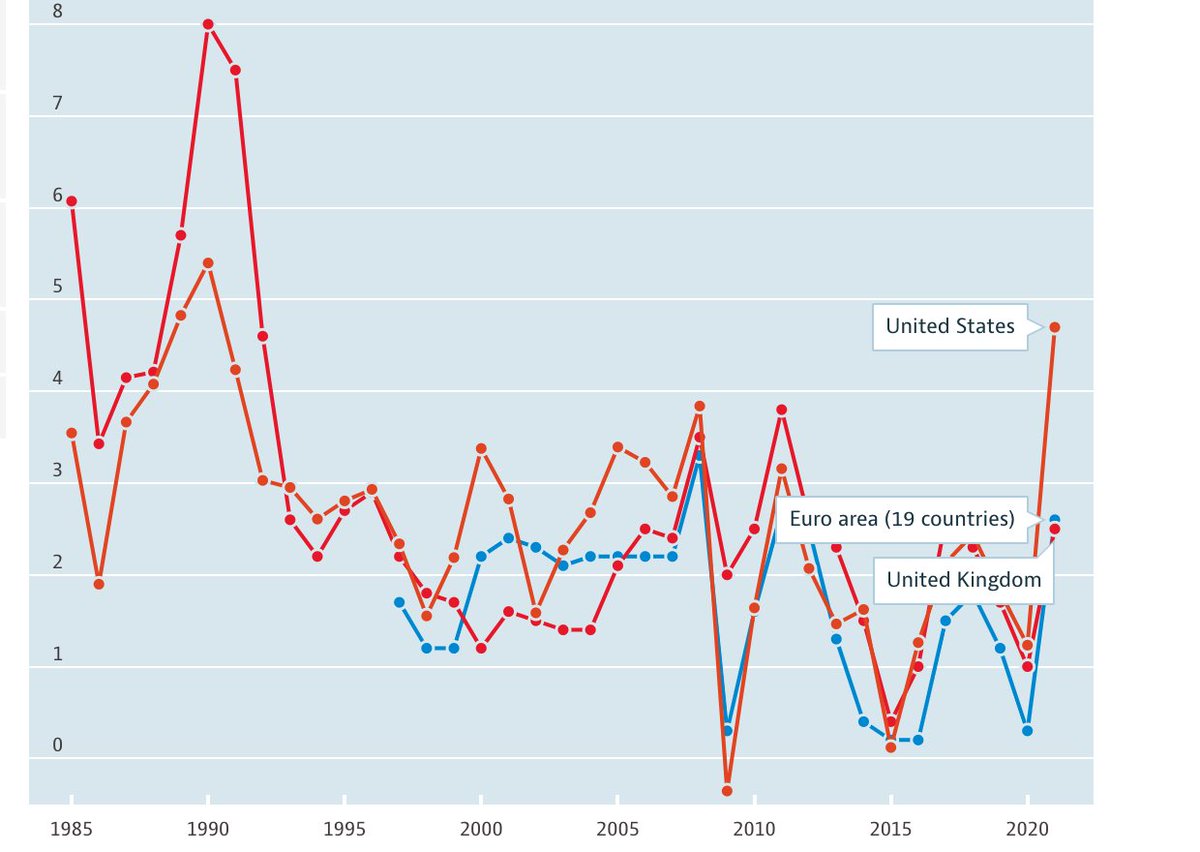
17/ here is the decade-by-decade overview of the effective cost of U.S. federal debt (r) (the return on all marketable Treasury debt) and the nominal growth rate (g). r>g in the 80s and 90s.

18/ full slide deck here brookings.edu/wp-content/upl…
paper draft here brookings.edu/wp-content/upl…
paper draft here brookings.edu/wp-content/upl…
19/of course, there are macro models in which debt is not fully backed by future S, but partly by future debt itself. in these models, typically without long-lived investors and without aggregate risk, the no-bubble constraint is violated. our approach rules out these bubbles.

20/Caution: These models do not identify the US as an obvious candidate for engineering bubbles in the debt market.
22/ comparison of this approach to fiscal sustainability to other approaches here macfinancesociety.files.wordpress.com/2022/08/mfs_ha…
• • •
Missing some Tweet in this thread? You can try to
force a refresh