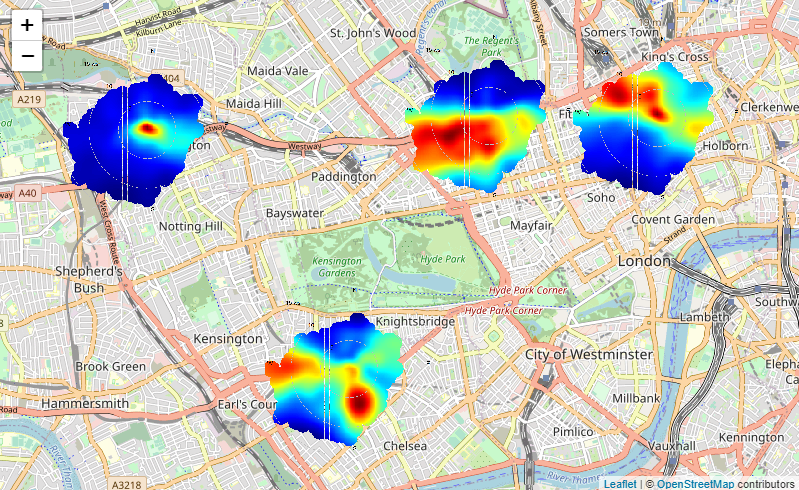
I'm excited to announce that the #rstats {openairmaps} 📦 is now on CRAN for use by the #AirQuality community. Combine the toolset of {#openair} with the JS library {#leaflet} to create interactive air quality HTML maps. 🧵1/5 

Using `networkMap()` you can visualise many air quality networks in the UK and Europe, with some customisation options like adding layer control menus and selecting your own base map. 🧵2/5 

The `polarMap()` family lets you use directional analysis plots as markers. This gives better spatial context to your, e.g., polar plots. Can plot different plot types (polar annulus, frequency roses, pollution roses, etc.) and multiple pollutants at once. 🧵3/5 

The `trajMap()` and `trajLevel()` functions both exist to visualise HYSPLIT trajectories. Layer control interfaces allow you to show/hide different trajectory paths. Options to colour by, e.g., pollutant concentrations on arrival. 🧵4/5 

This package is co-authored with Prof David Carslaw ({#openair}📦author & maintainer), and is the first package I've written for a CRAN release. Open to feature requests/bug reports:
Dev website: github.com/davidcarslaw/o…
Learn about {openair}:
bookdown.org/david_carslaw/…
🧵5/5
Dev website: github.com/davidcarslaw/o…
Learn about {openair}:
bookdown.org/david_carslaw/…
🧵5/5
• • •
Missing some Tweet in this thread? You can try to
force a refresh


