Fernando Profile picture
Sep 18 14 tweets 4 min read
EXCESS vs. SPIKE
The same, but not the same. A thread on what they are and how I use them.

🧵 #marketprofile
In its constant search for fair value, the market looks for selling exhaustion at the lows (the demand exceeds the supply and sellers are getting filled at higher prices so there’s no more interest to sell at lower prices)...
... and buying exhaustion at the highs (the supply exceeds the demand and buyers are getting filled at lower prices so there’s no more interest to buy at lower prices).
So, based on that principle, we’d like to see what’s called excess at the edges of an auction. In this example, we’ve got a nice excess both at the low and at the high of the session on the TPO profile and a nice tapering on the volume profile.
Now we also see the same profile but extended. These are basically 30min candles. We see that we had a breakout from the previous resistance, saw selling exhaustion at the top, buyers were unable to break out of value again and the session ended up closing right below the VPOC.
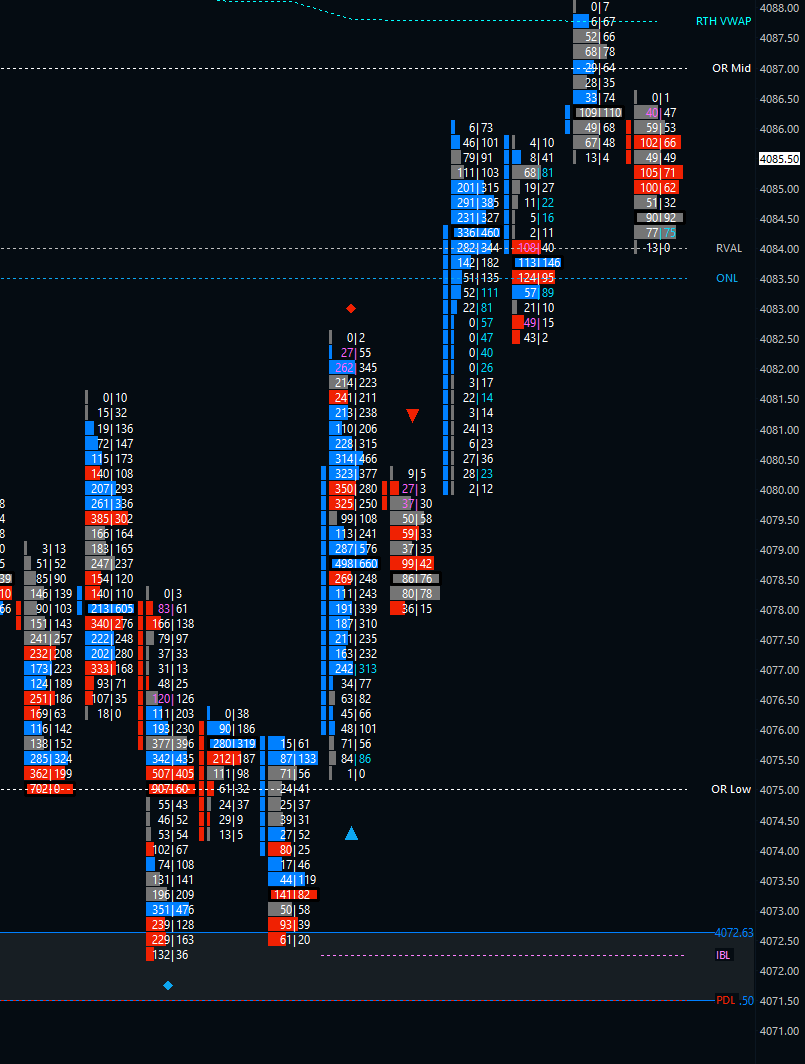
In this session we also have what looks like an excess but if we look at how the session developed, we can see that this “excess” was formed in the last half hour of the session. This is called a “spike”. So, what’s the difference between excess and a spike?
There are three components to an auction:
Price, which advertises opportunity.
Time, which regulates all opportunities.
Volume, which measures the success or failure of the advertised opportunities.
If we consider price an advertising mechanism, in the first example higher prices were advertised but market participants weren’t convinced that fair value was to be found up there so those prices were rejected later in the session, leaving that excess high.
In the case of the session ending with a spike, those higher prices are advertised close to the end of the session and therefore there’s not really enough time left to find out if those higher prices are really being validated by time and volume.
A validation, or a rejection, of those prices is then left for the following session. And that’s how we can use a spike to gauge the market in relation to the previous session. Using the area of the breakout from that last period as the spike base we can think of it this way:
1) Volume being built (2-way trade) within the spike (or higher): Those higher prices are being accepted.

2) Volume being built around the spike base: Indecision. No side seems to be convinced of where fair value is to be found.
3) Volume being built below the spike base: The higher prices have been, at least for the time being, rejected and we can consider that spike an excess.
For those curious about what happened to that spike: it got quickly rejected at the beginning of the next session (sad trombone).
To add context: that spike turned out to be a failed breakout from a multiday consolidation.
That failed breakout was followed by a large liquidation that took the market not only back inside the range but broke to the downside afterwards.

• • •

Missing some Tweet in this thread? You can try to force a refresh
 

Keep Current with Fernando

Fernando Profile picture

Stay in touch and get notified when new unrolls are available from this author!

Read all threads

This Thread may be Removed Anytime!

PDF

Twitter may remove this content at anytime! Save it as PDF for later use!

Try unrolling a thread yourself!

how to unroll video
  1. Follow @ThreadReaderApp to mention us!

  2. From a Twitter thread mention us with a keyword "unroll"
@threadreaderapp unroll

Practice here first or read more on our help page!

More from @perushka

Jun 5
1/
A lot of you asked on my last thread if I've got rules for my entries and stops on the ORL to mid trade. I don't, I do it based on what I'm seeing. To be honest, I don't know if it's the best way to trade this idea but it's the one that fits my style.

Here are some examples:
2/
From last Thursday:
- Sellers can't get below the PDL and get trapped/absorbed.
- When we come back, we do with lower volume and they can't even get to the IBL.
- Once we get back inside the OR again, we get a clean rejection of the ORL resulting in a short covering rally.
3/
- The RTH VWAP being just above the OR mid made it also easier to hold to target.
Read 8 tweets
Jun 3
1/
Many of you might have read @Michigandolf’s tweets about the ORL to ORM trade and probably also follow me after Horse mentioned me in such tweets.

I thought you might be interested in how this trade came to be and what I learned from all this. So, here’s a 🧵 about it:
2/
It all started after seeing some great stats shared by @TheFakeAlec about the odds of each period putting a LOD or HOD.

That made me wonder if I could find anything interesting by doing some backtesting on the 30min OR in addition to what I had learned from Horse.
3/
So, I started looking at what happened in the past months (this was mid December 2021). I didn’t have an idea or thesis that needed an answer, I just defined some things I wanted to look at and started logging them.
Read 19 tweets
Feb 2
1/
I've been reworking my daily debriefs and wanted to share the new format with you, guys.

I think doing a proper debrief at the end of the day is very, very helpful since we might have our actions during the day completely different in our minds than how they actually were.
2/
The header is pretty basic but something I find helpful is to give each day a name. It might be a general name (FOMC) or something personal (First time holding a trade for more than 20pt), but I think this helps to recall the day when looking back at it sometime in the future.
3/
Next thing is a quick overview of my goals and the actual results compared to those goals. The idea here is, of course, to get better over time. We might slip into old patterns now and then, but the goal should be to have consistent YES's...
Read 15 tweets
Dec 22, 2021
1/
Some more #ES stats, this time focused on overnight inventory correction and on B-period in relation to A-period.

The date range is the same as in the previous thread: +/- the past 90 days.
2/
I considered it a correction when 10pts or more were corrected in relation to the ETH closing price.

- Overnight Inventory was corrected 60% of the time.

- When the RTH session opened within ¼ of the ETH range from the ETH high or low, that figure increased to 66.75%.
3/
- When the RTH session opened within 5pts of the ETH high or low, that figure increased to 77%.

- Whenever ON Inventory was corrected,
that correction happened during A-Period 77.5% of the time.
Read 9 tweets
Dec 15, 2021
1/
Some further stats on #ES, this time focused on the 30min OR. As well observed by @Michigandolf on my last thread, results might be a bit skewed due to the high volatility in the past weeks. Similar as the last thread, these figures are also based on the past 90 days.
2/
Some notes first:
• Figures are rounded to a quarter of a percent.

• Any breakout smaller than 3pts is counted as a false breakout.

• Time zone used is ET
3/
General Stats:

• The OR is broken 97% of the time.

• 56.50% of the time there’s a retest of the OR boundary within 20m after the breakout.

• Average MFE after breakout: 20.00 pts.

• Minimum MFE after breakout: 4.00 pts.

• Maximum MFE after breakout: 60.50 pts.
Read 11 tweets
Dec 13, 2021
1/
Motivated by this fantastic thread, I did some research on #ES based on the past 90 (calendar) days. I focused on the stats that matter to me, so you'll find fewer data points than on the original thread.

2/
Chances of HOD or LOD being greater than 30m OR:
76.56%

Chances of HOD and LOD being greater than 30m OR:
20.31%
3/
Chances of HOD or LOD being greater than IB:
87.50%

Chances of HOD and LOD being greater than IB:
6.25%
Read 7 tweets

Did Thread Reader help you today?

Support us! We are indie developers!


This site is made by just two indie developers on a laptop doing marketing, support and development! Read more about the story.

Become a Premium Member ($3/month or $30/year) and get exclusive features!

Become Premium

Don't want to be a Premium member but still want to support us?

Make a small donation by buying us coffee ($5) or help with server cost ($10)

Donate via Paypal

Or Donate anonymously using crypto!

Ethereum

0xfe58350B80634f60Fa6Dc149a72b4DFbc17D341E copy

Bitcoin

3ATGMxNzCUFzxpMCHL5sWSt4DVtS8UqXpi copy

Thank you for your support!

Follow Us on Twitter!

:(