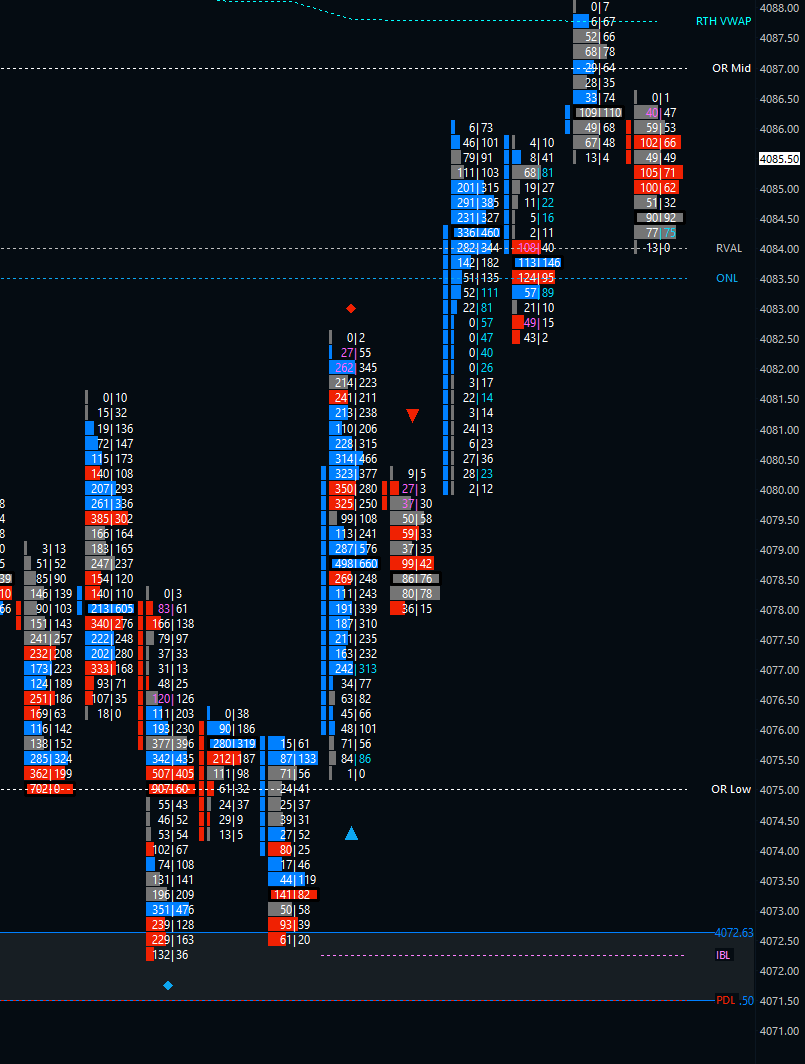
EXCESS vs. SPIKE
The same, but not the same. A thread on what they are and how I use them.
🧵 #marketprofile
In its constant search for fair value, the market looks for selling exhaustion at the lows (the demand exceeds the supply and sellers are getting filled at higher prices so there’s no more interest to sell at lower prices)...
Jul 28, 2022 • 13 tweets • 4 min read
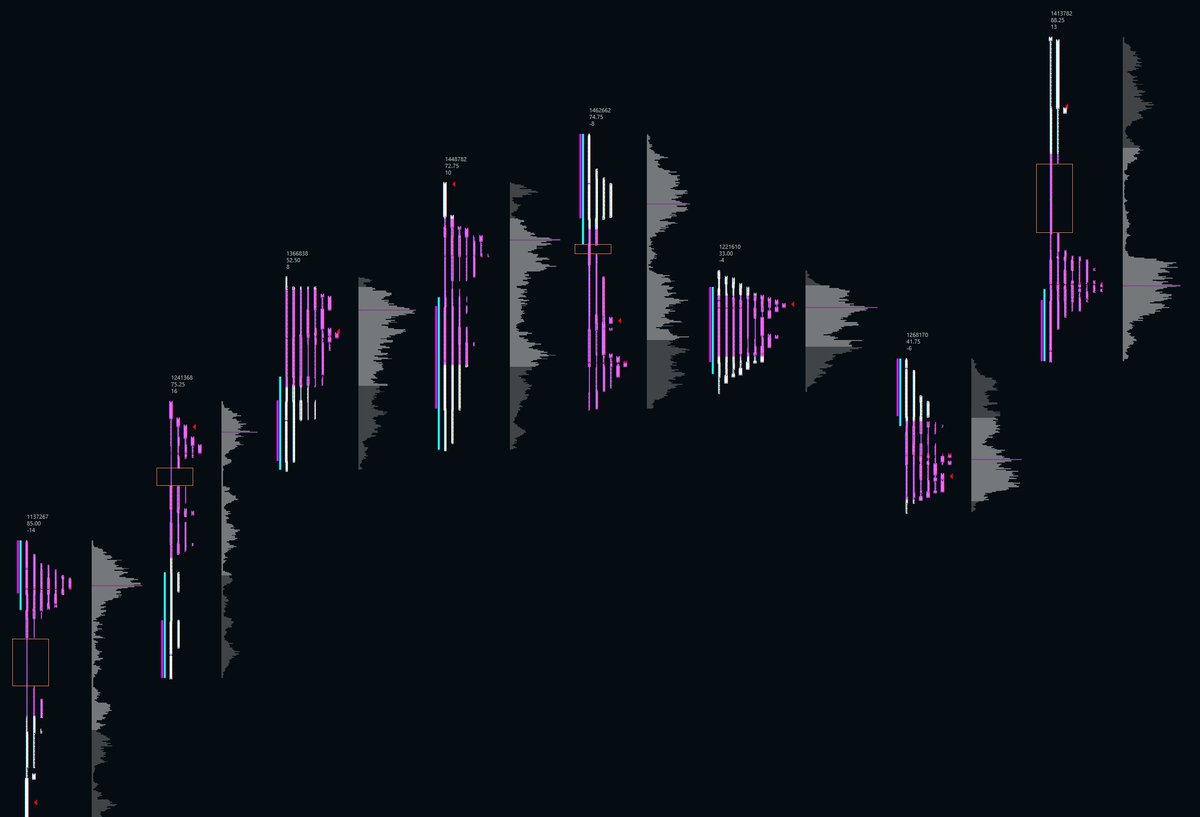
1/ A thread on single prints and how I use them. #marketprofile#tpo
🧵⬇️ 2/ For those unfamiliar with them, single prints look like this (orange box) on a TPO profile. They represent areas in which there has been no proper 2-way trade. That makes them areas of interest and, on the other hand, they can help us gauge the strength of buyers and sellers.
Jun 5, 2022 • 8 tweets • 3 min read
1/ A lot of you asked on my last thread if I've got rules for my entries and stops on the ORL to mid trade. I don't, I do it based on what I'm seeing. To be honest, I don't know if it's the best way to trade this idea but it's the one that fits my style.
Here are some examples:
2/ From last Thursday:
- Sellers can't get below the PDL and get trapped/absorbed.
- When we come back, we do with lower volume and they can't even get to the IBL.
- Once we get back inside the OR again, we get a clean rejection of the ORL resulting in a short covering rally.
Jun 3, 2022 • 19 tweets • 5 min read
1/ Many of you might have read @Michigandolf’s tweets about the ORL to ORM trade and probably also follow me after Horse mentioned me in such tweets.
I thought you might be interested in how this trade came to be and what I learned from all this. So, here’s a 🧵 about it:
2/ It all started after seeing some great stats shared by @TheFakeAlec about the odds of each period putting a LOD or HOD.
That made me wonder if I could find anything interesting by doing some backtesting on the 30min OR in addition to what I had learned from Horse.
Feb 2, 2022 • 15 tweets • 4 min read
1/ I've been reworking my daily debriefs and wanted to share the new format with you, guys.
I think doing a proper debrief at the end of the day is very, very helpful since we might have our actions during the day completely different in our minds than how they actually were.
2/ The header is pretty basic but something I find helpful is to give each day a name. It might be a general name (FOMC) or something personal (First time holding a trade for more than 20pt), but I think this helps to recall the day when looking back at it sometime in the future.
Dec 22, 2021 • 9 tweets • 2 min read
1/ Some more #ES stats, this time focused on overnight inventory correction and on B-period in relation to A-period.
The date range is the same as in the previous thread: +/- the past 90 days.
2/ I considered it a correction when 10pts or more were corrected in relation to the ETH closing price.
- Overnight Inventory was corrected 60% of the time.
- When the RTH session opened within ¼ of the ETH range from the ETH high or low, that figure increased to 66.75%.
Dec 15, 2021 • 11 tweets • 3 min read
1/ Some further stats on #ES, this time focused on the 30min OR. As well observed by @Michigandolf on my last thread, results might be a bit skewed due to the high volatility in the past weeks. Similar as the last thread, these figures are also based on the past 90 days.
2/ Some notes first:
• Figures are rounded to a quarter of a percent.
• Any breakout smaller than 3pts is counted as a false breakout.
• Time zone used is ET
Dec 13, 2021 • 7 tweets • 2 min read
1/ Motivated by this fantastic thread, I did some research on #ES based on the past 90 (calendar) days. I focused on the stats that matter to me, so you'll find fewer data points than on the original thread.