America’s middle class is vanishing.
In the last 20 years, the share of wealth held by the middle class dropped more than 8%, while the share of wealth held by the top 1% increased almost 8%!
Why is this happening, and is this trend going to continue?
Let’s find out 👇
1/25
In the last 20 years, the share of wealth held by the middle class dropped more than 8%, while the share of wealth held by the top 1% increased almost 8%!
Why is this happening, and is this trend going to continue?
Let’s find out 👇
1/25
Since 2002, the share of wealth held by the middle class has dropped from 36% to 28%.
2/25
2/25

Over the same time period, the share of wealth held by the top 1% has increased from 25% to 32%.
3/25
3/25

In 2014, the share of wealth held by the top 1% exceeded the share of wealth held by the middle class, defined here as the 50th to 90th percentile.
4/25
4/25

If we look at the share of wealth held by the top 1%, the trend looks extremely similar to the trend in the stock market.
This makes sense.
Wealthy people own a lot of assets, so if asset prices rise, that helps them.
5/25
This makes sense.
Wealthy people own a lot of assets, so if asset prices rise, that helps them.
5/25

The middle class doesn’t hold nearly the amount of financial assets as the top 1% and are much more dependent on the real economy for wage growth.
Therefore, what we really have to analyze is why asset prices have outpaced the real economy so much.
6/25
Therefore, what we really have to analyze is why asset prices have outpaced the real economy so much.
6/25

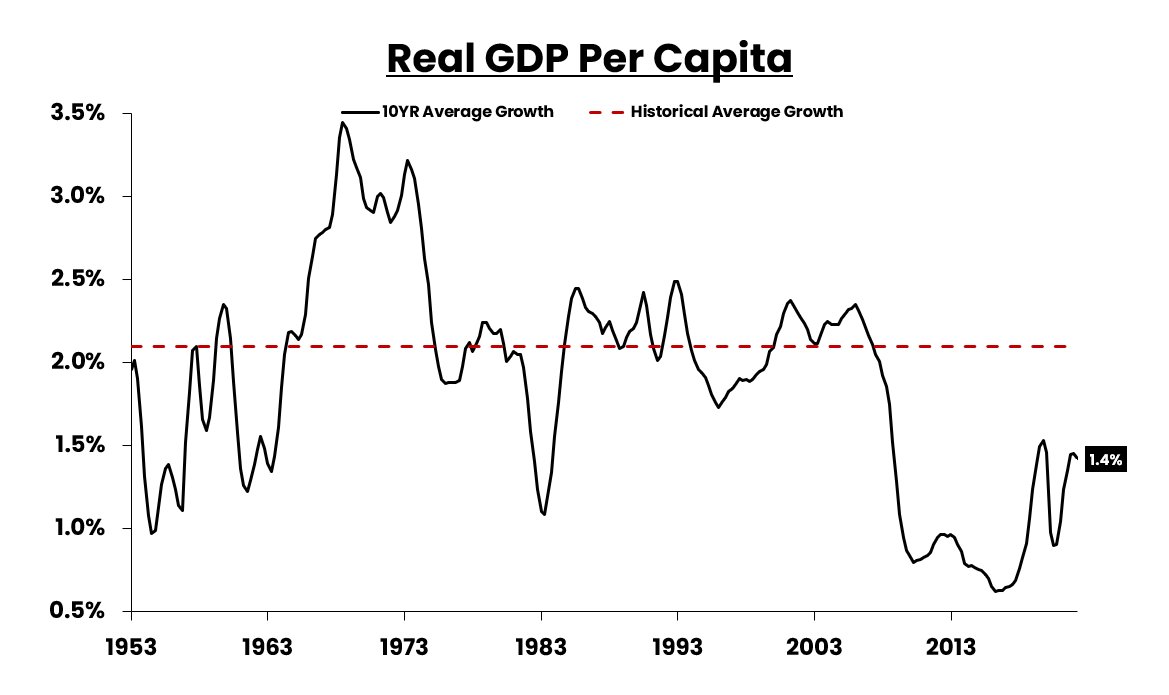
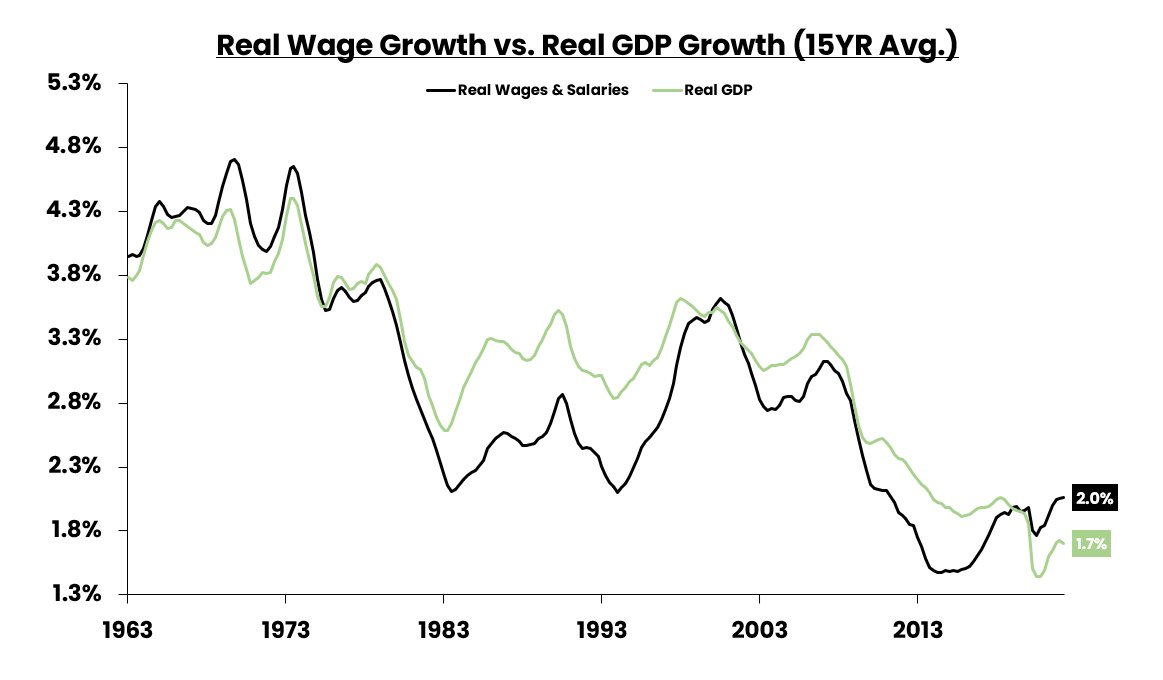
Wage growth is tied to economic growth. There is no way around it.
Weaker than normal wage growth is a SYMPTOM of weaker-than-average economic growth.
7/25
Weaker than normal wage growth is a SYMPTOM of weaker-than-average economic growth.
7/25

You cannot generate 5% wage growth with 2% GDP growth.
So we must also understand why economic growth has been so weak.
8/25
So we must also understand why economic growth has been so weak.
8/25

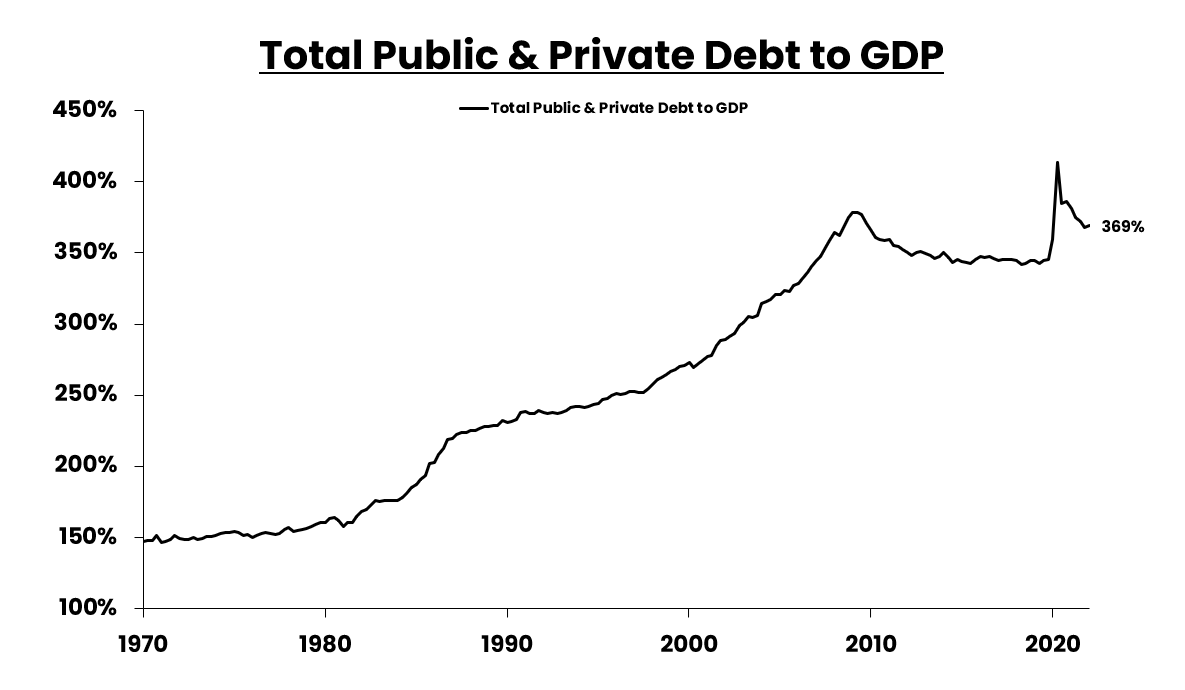
Over the long-run, economic growth is a function of population growth and productivity growth.
Productivity growth is closely linked to debt levels.
When a use of debt doesn’t generate an income stream, this is an “unproductive” use of debt that crushes productivity.
9/25
Productivity growth is closely linked to debt levels.
When a use of debt doesn’t generate an income stream, this is an “unproductive” use of debt that crushes productivity.
9/25
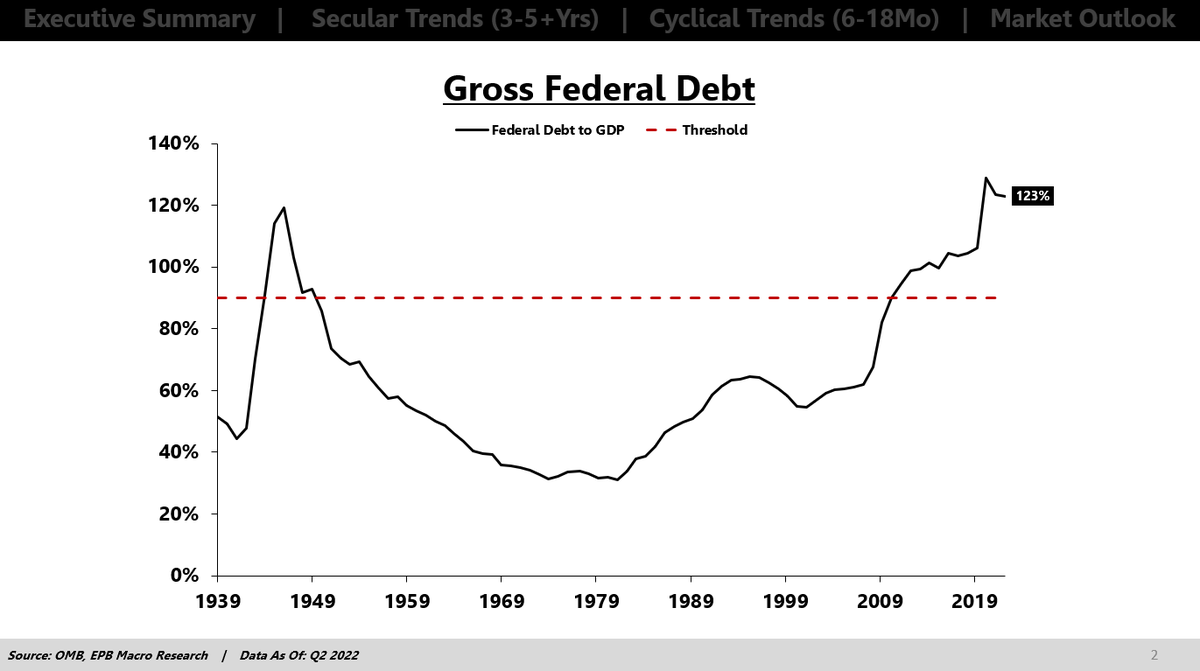
Since the 1980s, we’ve taken a path of massively increasing debt.
The increase in the debt to GDP ratio tells us that this debt was not used productively.
Once debt levels became excessive, there was a sharp drop in economic growth and, thus, wage growth.
10/25
The increase in the debt to GDP ratio tells us that this debt was not used productively.
Once debt levels became excessive, there was a sharp drop in economic growth and, thus, wage growth.
10/25

So the high debt levels hurt economic growth, which reduced wage growth, harming the middle class.
Why were asset prices and the top 1% unaffected by this reduction in growth?
11/25
Why were asset prices and the top 1% unaffected by this reduction in growth?
11/25
Over the last 20 years, each time the economy ran into a debt problem (recession), the answer was to lower interest rates.
Lower interest rates was an easy way to kick the can down the road rather than dealing with the root cause (too much debt!)
12/25
Lower interest rates was an easy way to kick the can down the road rather than dealing with the root cause (too much debt!)
12/25

So interest rates declined, and asset prices recovered because the debt was easier to service, but the debt load still remained, suppressing economic growth and, thus, wage growth.
Asset holders make it out alive while workers suffer the consequences of the debt.
13/25
Asset holders make it out alive while workers suffer the consequences of the debt.
13/25
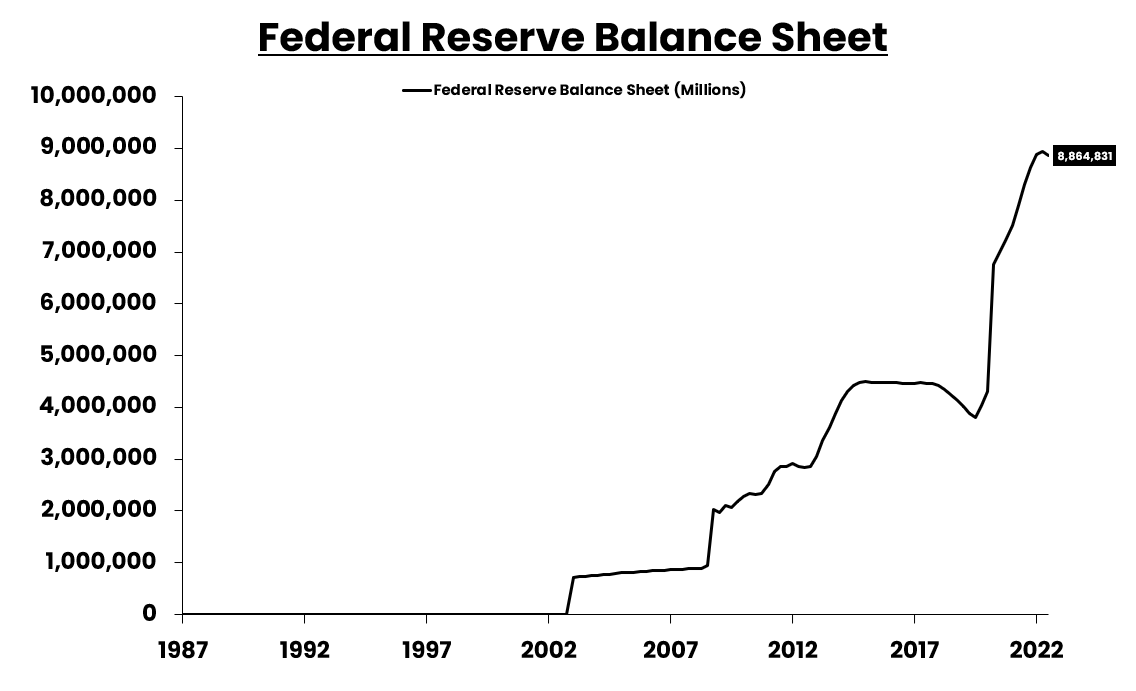
When interest rates hit 0% after 2008, we still didn’t want to solve the debt problem, but we couldn’t lower interest rates, so we started “Quantitative Easing.”
This increased liquidity in financial markets, again helping assets, but did nothing for the real economy
14/25
This increased liquidity in financial markets, again helping assets, but did nothing for the real economy
14/25
The concept behind these policies was that the economy would rise to the level of asset prices.
Asset holders were supposed to spend this newfound net worth into the economy, jumpstarting the economic cycle.
Ben Bernanke said this exactly.
15/25
Asset holders were supposed to spend this newfound net worth into the economy, jumpstarting the economic cycle.
Ben Bernanke said this exactly.
15/25

But as Robert Shiller noted, as well as other academic research, the wealth effect, particularly for the stock market, is a flawed concept. It doesn’t work.
16/25
16/25

So all that happened was that asset prices were bolstered by lower rates and increased liquidity, but the economy still had to deal with the crushing debt burden that refused to be solved.
17/25
17/25

Policymakers are very worried about correcting the debt problem because that means people (asset holders) will lose a lot of money as the economy experiences debt deflation.
18/25
18/25
So instead, the policy choice has been to support asset prices, but the outcome has been disastrous for the middle class. Asset prices, like homes, have increased way faster than wages, creating a situation of gross unaffordability.
19/25
19/25

20 years of conducting policy in this fashion, and what do we have?
We have asset prices that are dangerously elevated relative to the underlying economy, and we still have ALL THE DEBT.
20/25
We have asset prices that are dangerously elevated relative to the underlying economy, and we still have ALL THE DEBT.
20/25

Correcting the debt problem would result in short-term (extreme) pain, but longer-term prosperity for all people as growth and wages could accelerate without a crushing debt burden.
21/25
21/25
Pursuing the same policies will result in the same outcome. Ever-increasing debt, lower economic growth, falling real wages but…potentially higher asset prices if the decline in growth is met with lower rates and more liquidity.
22/25
22/25

This lower growth and inability to afford assets (homes) has resulted in delayed household formation and lower birth rates, worsening our demographics. This is happening in every major country pursuing the same policies, but that is a topic for another day.
23/25
23/25

If you liked this thread, please give me a follow 👉@EPBResearch
I post threads like this almost every week.
24/25
I post threads like this almost every week.
24/25
And if you prefer video content (I do), then check out this topic presented in video form on my YouTube Channel.
Watch on YouTube:
25/25
Watch on YouTube:
25/25

• • •
Missing some Tweet in this thread? You can try to
force a refresh