1/6
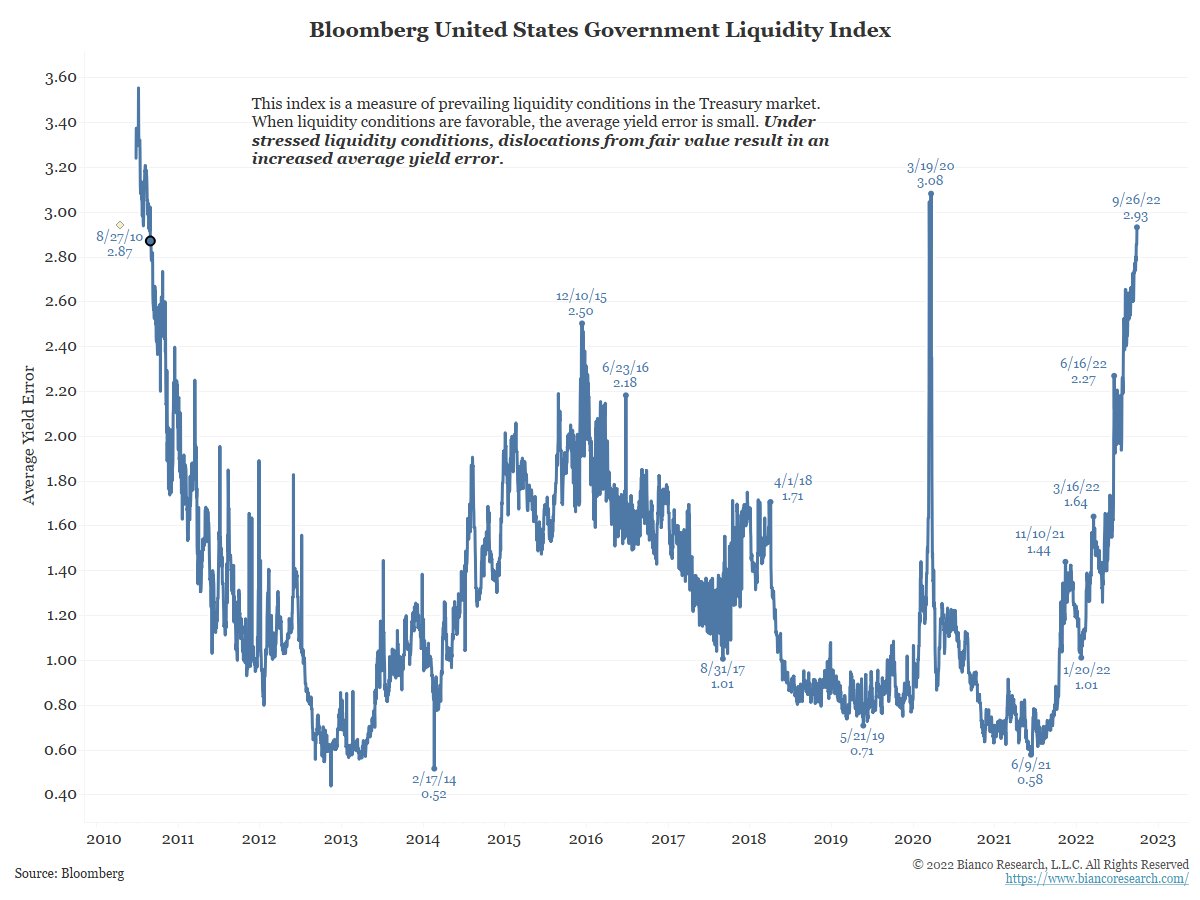
The US bond market is in a very dark, bad place right now.
Outside of the worst of the pandemic, Bloomberg's measure of liquidity is at this worst level in 12+ years.
The US bond market is in a very dark, bad place right now.
Outside of the worst of the pandemic, Bloomberg's measure of liquidity is at this worst level in 12+ years.
2/6
BofA's Global Financial Stress Indicator is at readings only seen twice in the last 13 years ... the worst of the pandemic shutdowns in 2020 and the Great Recession in 2009.
BofA's Global Financial Stress Indicator is at readings only seen twice in the last 13 years ... the worst of the pandemic shutdowns in 2020 and the Great Recession in 2009.

3/6
The Move Index, a measure of implied volatility (the "VIX of the bond market"), closed today at one of the highest readings in its 30+ year history.
The Move Index, a measure of implied volatility (the "VIX of the bond market"), closed today at one of the highest readings in its 30+ year history.

4/6
Summing up, the global bond market has lost over one-fifth of its value this year.
Before 2022 such a move was thought to be impossible.
Note that this index is priced in dollars, and with 53% of this index is foreign-denominated bonds, the strong dollar is killing it.
Summing up, the global bond market has lost over one-fifth of its value this year.
Before 2022 such a move was thought to be impossible.
Note that this index is priced in dollars, and with 53% of this index is foreign-denominated bonds, the strong dollar is killing it.


5/6
This is why the US aggregate (100% dollar-denominated bonds) is doing relatively better than the global aggregate.
Note the word RELATIVE, this index is still setting records with its losses, just not to the degree that the seen by the Global Aggregate.
This is why the US aggregate (100% dollar-denominated bonds) is doing relatively better than the global aggregate.
Note the word RELATIVE, this index is still setting records with its losses, just not to the degree that the seen by the Global Aggregate.

6/6
Remember, an illiquid, volatile, dysfunctional bond market can destroy risk markets like equities, and entire economies ... which you can argue is exactly what it has been doing in 2022.
This series of charts should be a big concern at the central bank. Is it?
Remember, an illiquid, volatile, dysfunctional bond market can destroy risk markets like equities, and entire economies ... which you can argue is exactly what it has been doing in 2022.
This series of charts should be a big concern at the central bank. Is it?
• • •
Missing some Tweet in this thread? You can try to
force a refresh