A COMPLETE COURSE with strategies on Trading for FREE!
Yes, you heard it right!
So, stop paying for webinars & watch these videos!
My objective with the #LearnwithTrendlineInvestor series on Youtube was to help people learn.
So, I hope it benefits!
Let’s go! 🧵...
Yes, you heard it right!
So, stop paying for webinars & watch these videos!
My objective with the #LearnwithTrendlineInvestor series on Youtube was to help people learn.
So, I hope it benefits!
Let’s go! 🧵...
1⃣ How to use Trading view - CHARTING TOOL?
In this video I cover all the basics a beginner needs to know as to how to use this simple yet amazing tool which is available for free
In this video I cover all the basics a beginner needs to know as to how to use this simple yet amazing tool which is available for free
2⃣ How to read CANDLESTICKS without knowing the names?
Candlesticks are the foundation of charting and I cover how to read candlestick charts without needing to know the names of them
Candlesticks are the foundation of charting and I cover how to read candlestick charts without needing to know the names of them
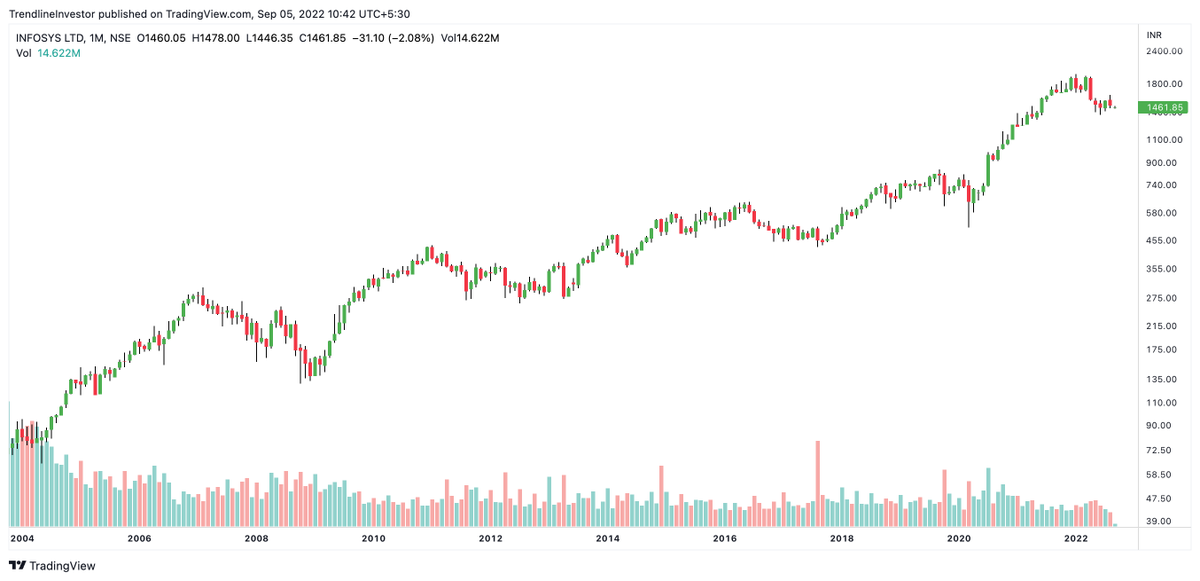
3⃣ When to use LOG/LINEAR CHARTS?
Even the biggest handles get this simple concept wrong and I teach how you can have a better perspective on charting by making a simple switch to log charts
Even the biggest handles get this simple concept wrong and I teach how you can have a better perspective on charting by making a simple switch to log charts
4⃣ The secrets to find a significant and reliable TRENDLINE!
It's easy to get carried away with trendlines as it is totally subjective. But, don't worry in this video I teach rules which you can use to identify valid trendlines and how to draw them!
It's easy to get carried away with trendlines as it is totally subjective. But, don't worry in this video I teach rules which you can use to identify valid trendlines and how to draw them!
5⃣ The psychology behind DEMAND & SUPPLY and how to read it!
Everything in this world is driven by demand and supply and so are stock prices and this is the heartbeat of technical analysis. So, do watch this video to understand the pulse of your stocks!
Everything in this world is driven by demand and supply and so are stock prices and this is the heartbeat of technical analysis. So, do watch this video to understand the pulse of your stocks!
6⃣ Find stock BUY/SELL SIGNALS using the CCI Indicator!
The most important diagnostic tool for me and a very important indicator for me that signals turning point in stocks. It’s very simple to understand, so give it a try after watching the video.
The most important diagnostic tool for me and a very important indicator for me that signals turning point in stocks. It’s very simple to understand, so give it a try after watching the video.
7⃣ Understand OUTPERFORMANCE & UNDERPERFORMANCE in stocks!
Worried that your PF is not moving up when markets are going up? Watch this video to understand the reason so that the next time you buy stocks with relative strength!
Worried that your PF is not moving up when markets are going up? Watch this video to understand the reason so that the next time you buy stocks with relative strength!
8⃣ The most important BREAKOUT scanner for me!
CCI based breakout scanner to identify swing trades/positional trades/investment ideas. With some effort you can find the next potential multibagger!
CCI based breakout scanner to identify swing trades/positional trades/investment ideas. With some effort you can find the next potential multibagger!
9⃣ The REVERSAL SCANNER that helps me identify great R:R trades!
CCI based Reversal scanner to spot low-risk opportunities that will help you with great R:R trades
CCI based Reversal scanner to spot low-risk opportunities that will help you with great R:R trades
🔟 SCAN & SHORTLIST stocks in a matter of mins!
Learn how I scan and shortlist stocks in just a matter of mins
Learn how I scan and shortlist stocks in just a matter of mins
1⃣1⃣ The most simplest strategy for beginners - HORIZONTAL BREAKOUT strategy!
A simple line yet the most powerful strategy that I’ve come across till now. If you are a beginner struggling then this is a MUST watch!
A simple line yet the most powerful strategy that I’ve come across till now. If you are a beginner struggling then this is a MUST watch!
1⃣2⃣ The most reliable pattern to spot multibaggers - INVERTED HnS!
My favourite pattern in the whole of technical analysis which is highly reliable and can help spot potential multibaggers
My favourite pattern in the whole of technical analysis which is highly reliable and can help spot potential multibaggers
1⃣3⃣ Big money is made with this TREND FOLLOWING strategy!
The only strategy you need to know. The greatest of great traders do trend following. So why not you?
The only strategy you need to know. The greatest of great traders do trend following. So why not you?
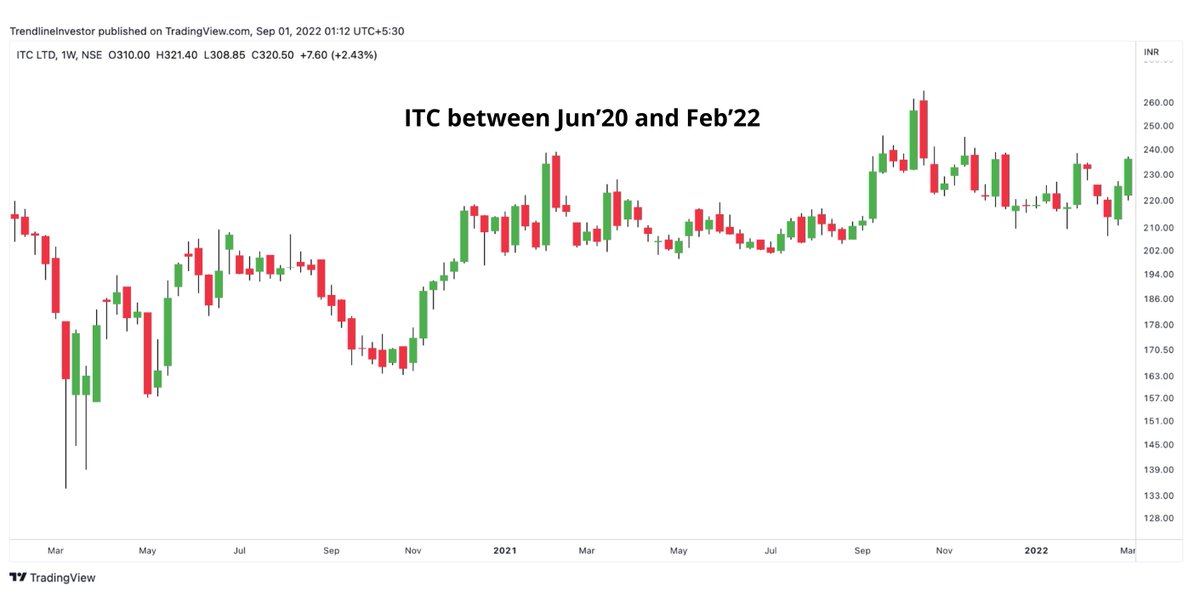
1⃣4⃣ The best traders analyse the stock in all time frames - Learn MULTI-TIME FRAME analysis!
Increase your winning probability by doing multi-time frame analysis. You do not want to buy a stock that is in a downtrend on Monthly/Weekly charts.
Increase your winning probability by doing multi-time frame analysis. You do not want to buy a stock that is in a downtrend on Monthly/Weekly charts.
1⃣5⃣ EXIT is when you make money!
I discuss exit strategies for stocks that are trending and also quite extended in this video
I discuss exit strategies for stocks that are trending and also quite extended in this video
1⃣6⃣ Learn while you trade - TRADING JOURNAL video
A journal is a must to know where you are right and wrong. This is the only secret to winning in markets. So learn how I do it in this video
A journal is a must to know where you are right and wrong. This is the only secret to winning in markets. So learn how I do it in this video
1⃣7⃣ The foundation for your trading career - RISK Management!
Well, this should have been the first video but if you have read till here then don't miss this. This is the first and foremost aspect in trading.
Well, this should have been the first video but if you have read till here then don't miss this. This is the first and foremost aspect in trading.
If you learnt something from my videos, please…
1. Retweet the first tweet
2. Follow @dmdsplyinvestor
3. Subscribe to my YouTube channel for more content! youtube.com/c/TrendlineInv…
1. Retweet the first tweet
https://twitter.com/dmdsplyinvestor/status/1574744531043438592?s=20&t=fciTCNjDTeRrJ0Zs7AbHvQ
2. Follow @dmdsplyinvestor
3. Subscribe to my YouTube channel for more content! youtube.com/c/TrendlineInv…
1⃣8⃣ If you have the time then don't forget to watch this important playlist where I traded live for a few months!
youtube.com/playlist?list=…
youtube.com/playlist?list=…
• • •
Missing some Tweet in this thread? You can try to
force a refresh