1/7
Today's edition of all is not well in the bond market.
------
The Move (the "VIX of the bond market") closed today at 158.12. This is its second highest print in 13 years.
Since 2009, the only day higher was March 9, 2020, arguably the worst market day of the pandemic.
Today's edition of all is not well in the bond market.
------
The Move (the "VIX of the bond market") closed today at 158.12. This is its second highest print in 13 years.
Since 2009, the only day higher was March 9, 2020, arguably the worst market day of the pandemic.

2/7
Every time the MOVE gets above 155, the Fed is having emergency meetings (to cut to 0% or print), bailouts are being constructed, and/or bond traders are running around with their hair on fire.
Given this, is it safe to assume all is well this time around?
Every time the MOVE gets above 155, the Fed is having emergency meetings (to cut to 0% or print), bailouts are being constructed, and/or bond traders are running around with their hair on fire.
Given this, is it safe to assume all is well this time around?
3/7
Add to the mix that liquidity is worsening, as measured by Bloomberg.
This level of illiquidity occurs when the bond market is dysfunctional.
Add to the mix that liquidity is worsening, as measured by Bloomberg.
This level of illiquidity occurs when the bond market is dysfunctional.

4/7
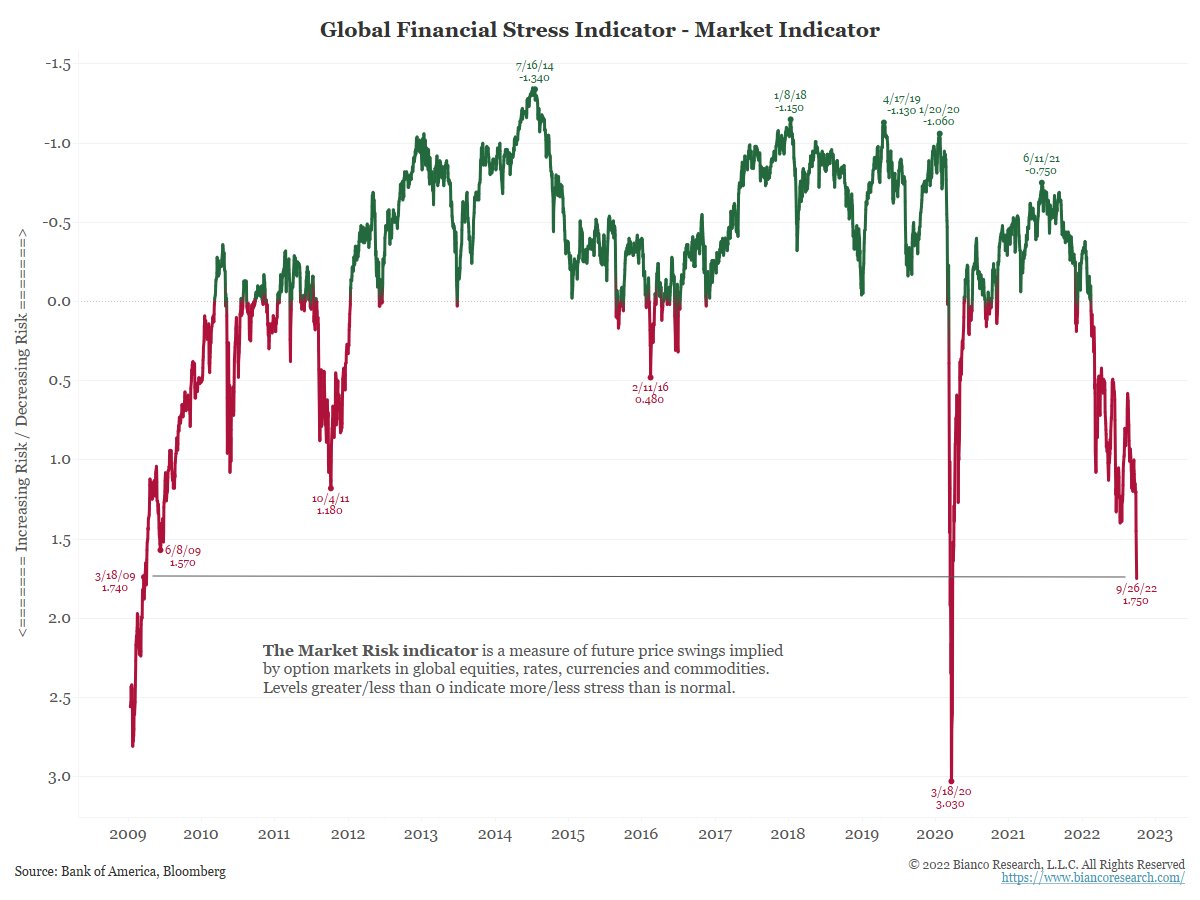
And BofA's Financial Stress Indicator is getting materially worse by the day.
Again, is/should this be a concern?
And BofA's Financial Stress Indicator is getting materially worse by the day.
Again, is/should this be a concern?
5/7
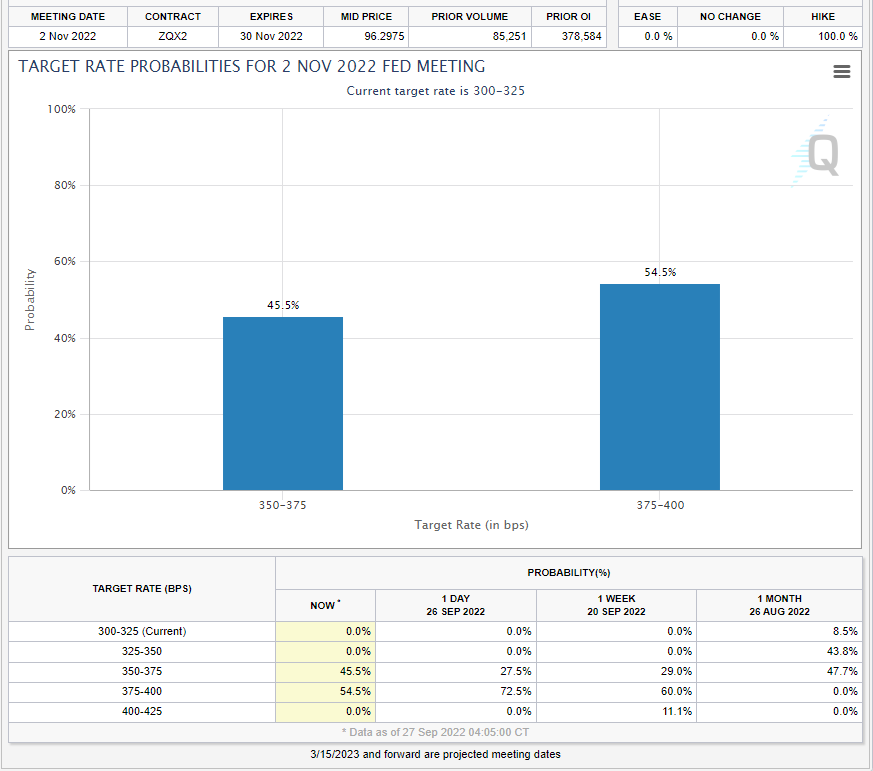
As noted above, in the past, when this was the backdrop, the Fed was cutting to zero and printing like mad.
Now, however, we have ongoing QT and the market STILL pricing in a 75 bps hike at the next FOMC meeting (Nov 2).
As noted above, in the past, when this was the backdrop, the Fed was cutting to zero and printing like mad.
Now, however, we have ongoing QT and the market STILL pricing in a 75 bps hike at the next FOMC meeting (Nov 2).
6/7
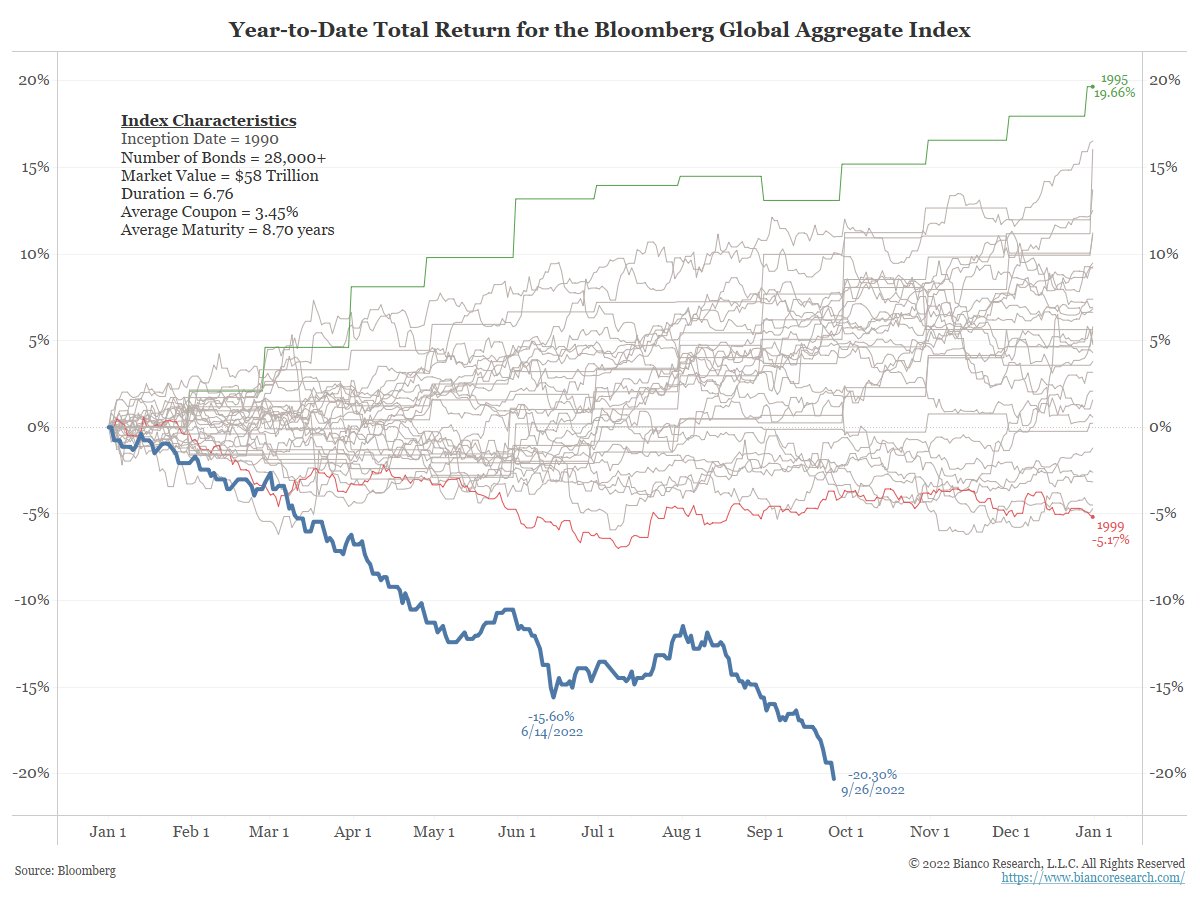
The bond market is very big, very opaque, and very complicated. This is why it blows up regularly (GFC 2008, repo 2019, COVID 2020, now???). What have been the warning signs trouble is brewing? The tweets above!
The bond market seems to see this, note the blue line!
The bond market is very big, very opaque, and very complicated. This is why it blows up regularly (GFC 2008, repo 2019, COVID 2020, now???). What have been the warning signs trouble is brewing? The tweets above!
The bond market seems to see this, note the blue line!
7/7
So I ask again, is this tweet thread a bunch of things that are not concerning this time around? if so, why?
Or does this tweet thread tell us there are big problems under the surface?
Q: Is this why the S&P 500 has been in a relentless decline over the last few weeks?
So I ask again, is this tweet thread a bunch of things that are not concerning this time around? if so, why?
Or does this tweet thread tell us there are big problems under the surface?
Q: Is this why the S&P 500 has been in a relentless decline over the last few weeks?
EVERYONE, PLEASE DISREGARD MY TWEET THREAD ABOVE ABOUT CONCERNS IN THE BOND MARKET.
I JUST LEARNED THAT JANET YELLEN SPOKE EXACTLY ONE HOUR AGO, AND ALL IS WELL, NOTHING TO SEE HERE.
PLEASE CARRY ON
I JUST LEARNED THAT JANET YELLEN SPOKE EXACTLY ONE HOUR AGO, AND ALL IS WELL, NOTHING TO SEE HERE.
PLEASE CARRY ON
https://twitter.com/financialjuice/status/1574868489021562897?s=20&t=691cQLGUpavyXuuyAviUqg
• • •
Missing some Tweet in this thread? You can try to
force a refresh