SPX 666…3333…2222…>4444…3333
BofA: we are tactical bears…“short twos & spoos” ‘til Halloween…SPX 3333 to force “policy panic”
BofA: we are tactical bears…“short twos & spoos” ‘til Halloween…SPX 3333 to force “policy panic”

BofA suggests waiting ~ 6 months
“Big Low” not ‘til Q1 when recession/credit shocks = “peak Fed”, “peak yields”, “peak US$”; trade of ‘23 short $, long EM, small cap, cyclical.
"Markets stop panicking when Central Banks start panicking"
“Big Low” not ‘til Q1 when recession/credit shocks = “peak Fed”, “peak yields”, “peak US$”; trade of ‘23 short $, long EM, small cap, cyclical.
"Markets stop panicking when Central Banks start panicking"
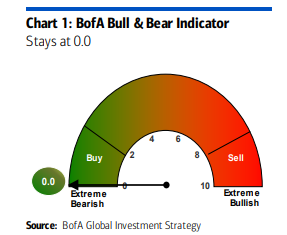
BofA Bull & Bear Indicator: 0.0
max bearish on deteriorating bond flows, credit technicals;
“contrarian buy” no workee when (as in 2008) 2sd credit event brewing
max bearish on deteriorating bond flows, credit technicals;
“contrarian buy” no workee when (as in 2008) 2sd credit event brewing
UK equity outflows on pace for worst year ever

2-year Treasuries yielding 240bps more than S&P500 dividend yield

So why are Treasury yields up? Hmm
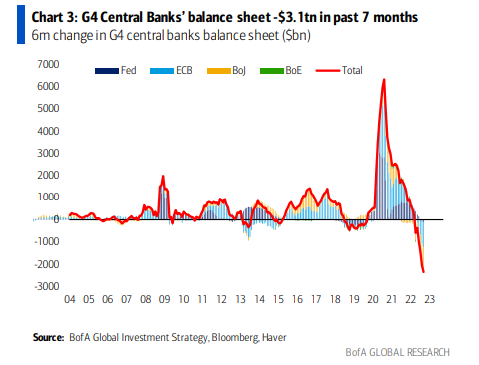
G4 Central Banks’ balance sheet -$3.1tn in past 7 months
G4 Central Banks’ balance sheet -$3.1tn in past 7 months
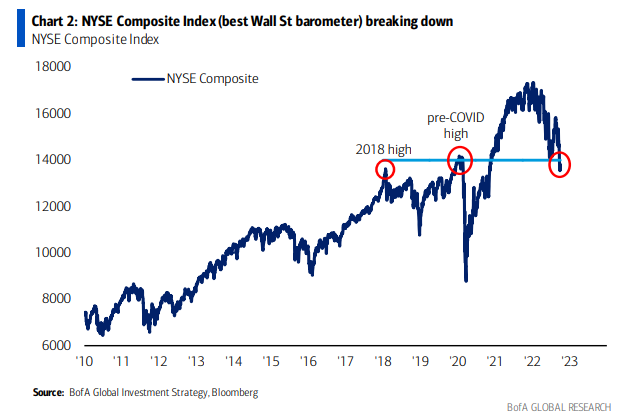
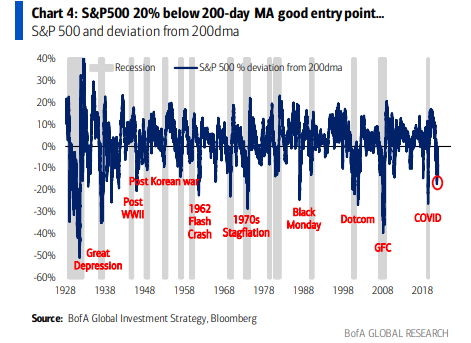
S&P500 20% below 200-day MA good entry point…
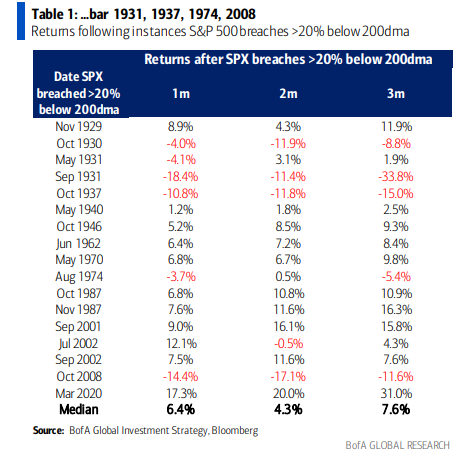
Returns following instances S&P 500 breaches >20% below 200dma
"Wall St disorder in 2022 reflects painful regime change as bullish deflationary era of peace, globalization, fiscal discipline, QE, zero rates, low taxes, inequality gives way to...
inflationary era of war, nationalism, fiscal panic, QT, high rates, high tazes, inclusion."
inflationary era of war, nationalism, fiscal panic, QT, high rates, high tazes, inclusion."
Government bonds, credit hit particularly hard this year relative to past experiences of war

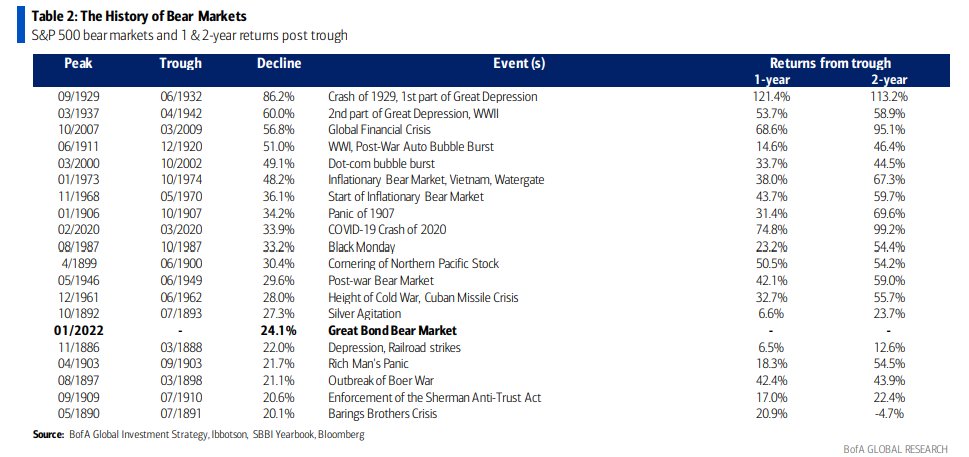
S&P 500 in 20th bear market past 140 years; ave peak to trough decline 37.3%, ave duration 289 days
history no guide to future but history says bear market ends Oct 19th 2022 (35th anniversary Black Monday) with S&P 500 @ 3020
history no guide to future but history says bear market ends Oct 19th 2022 (35th anniversary Black Monday) with S&P 500 @ 3020
Since March 23, 2020 (Covid lows) (total returns)
$ACWX +30%
$EEM +19%
$HYG +17%
$EMB -3%
$LQD -4%
$ACWX +30%
$EEM +19%
$HYG +17%
$EMB -3%
$LQD -4%

BofA dubs this "The Great Bond Bear Market"
S&P 500 bear markets and 1 & 2-year returns post trough...
S&P 500 bear markets and 1 & 2-year returns post trough...
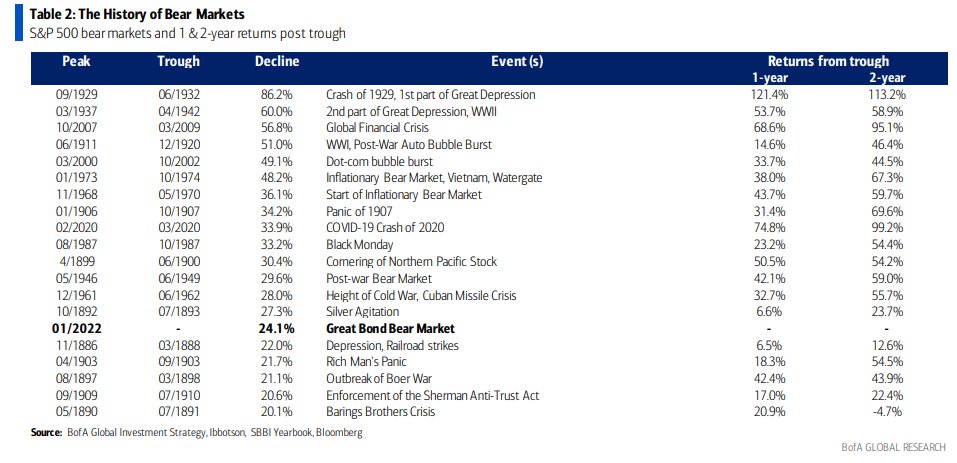
surge in bids accepted for NY Fed's overnight reverse repos $0 in Feb '21 to $2.4tn reflects broken, freaky post-QE financial system plumbing
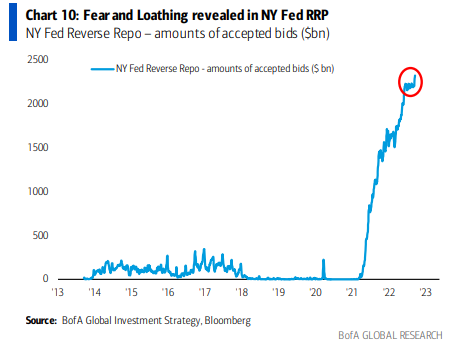
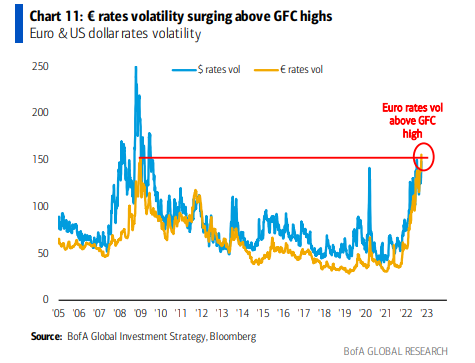
€ rates volatility surging above GFC highs
House prices falling

Gold: Longest streak of outflows since Jan’14

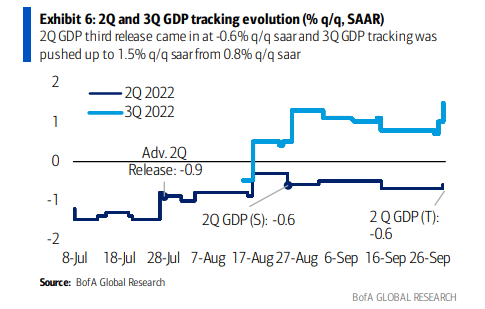
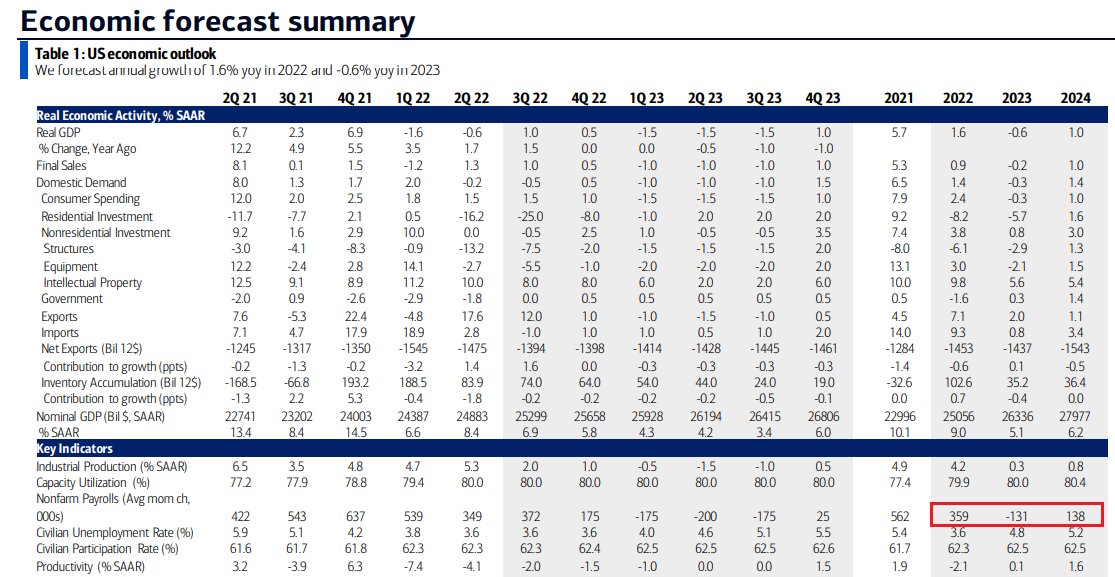
The personal saving rate was revised lower, suggesting households drew on savings to support spending amid rising inflation

2Q US GDP third estimate at -0.6%; 3Q pushed up to 1.5%
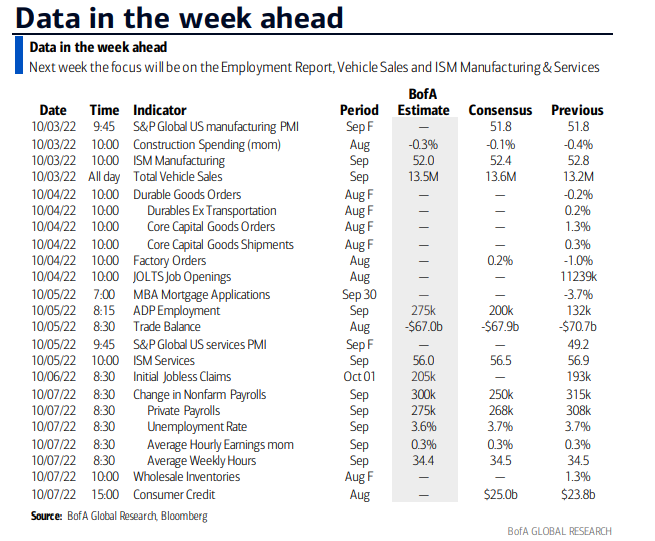
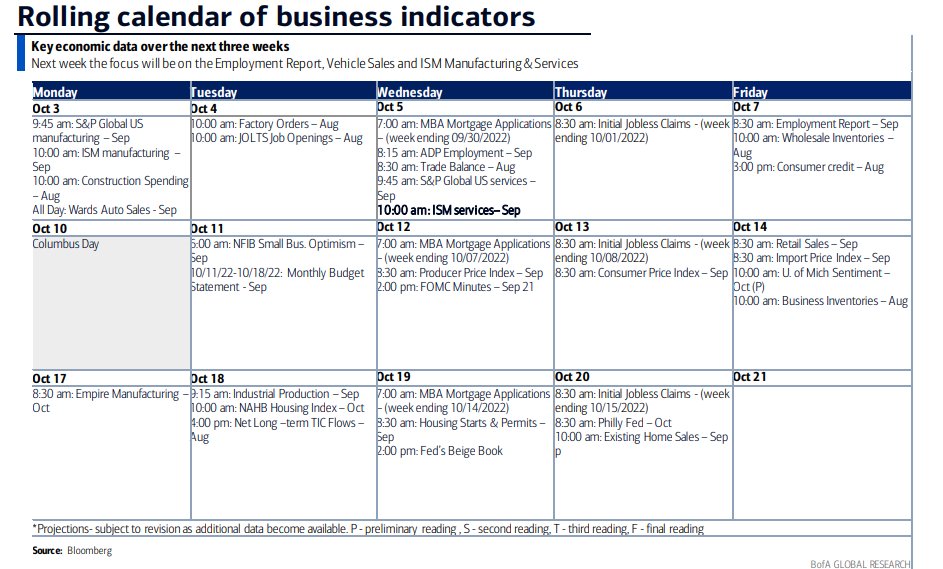
Next week the focus will be on the Employment Report, Vehicle Sales and ISM Manufacturing & Services
Data deck
Data deck
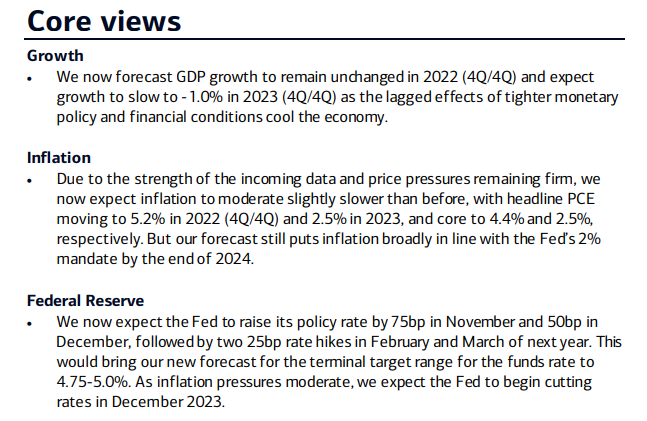
BofA:
We now forecast GDP growth to remain unchanged in 2022 (4Q/4Q) and expect growth to slow to -1.0% in 2023 (4Q/4Q)
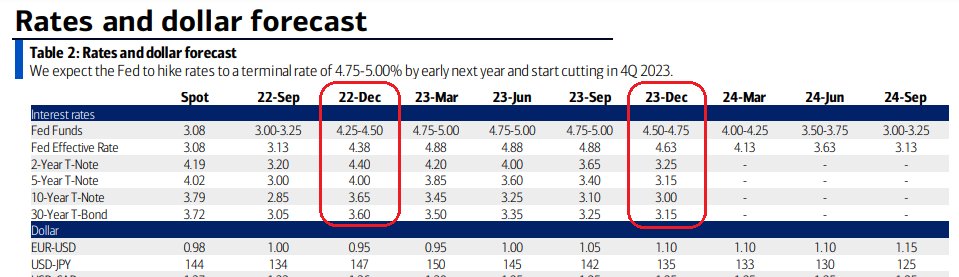
We now expect the Fed to raise its policy rate by 75bp in November and 50bp in December, followed by two 25bp rate hikes in February and March
We now forecast GDP growth to remain unchanged in 2022 (4Q/4Q) and expect growth to slow to -1.0% in 2023 (4Q/4Q)
We now expect the Fed to raise its policy rate by 75bp in November and 50bp in December, followed by two 25bp rate hikes in February and March
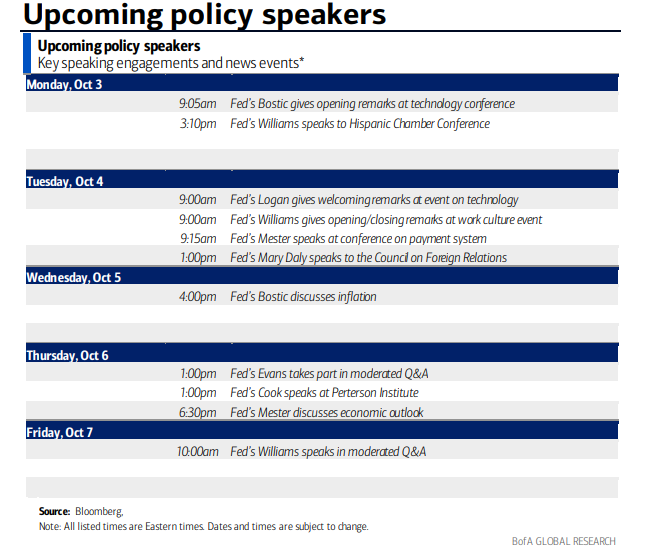
Lots of Fed Speak next week
BofA forecasts 7k net jobs created in 2023-24
BofA expects an apparent big Treasury bull market in 2023
Rolling calendar of business indicators
• • •
Missing some Tweet in this thread? You can try to
force a refresh