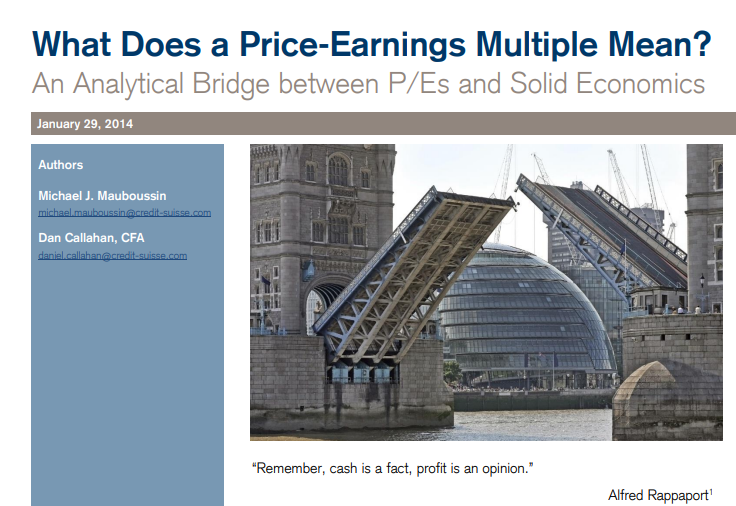
Michael Mauboussin's 2014 paper "What Does a P/E Multiple Mean" is a great guide to understanding the link between valuation, multiples and business economics (ROIC).
Here are some of my notes from reading it:
Multiples are a shorthand for valuation, not the valuation itself. Valuation should be driven by earnings and CFs
The value of a firm can be thought of in two parts:
- steady state value where NOPAT is held constant into perpetuity
- future value creation (growth opportunities)
The steady state component simply assumes that there's a core base of a business, the NOPAT of which can be maintained forever, and ROIC=cost of equity, so the steady-state PE multiple can be expressed as 1/CoE. eg. if the CoE is 8%, then the steady state PE mult should be 12.5x
Of course as rates and risk premiums move around, the CoE and thus the steady state PE multiple can change over time, rising during bull markets and low rates and falling during bear markets and rising rates
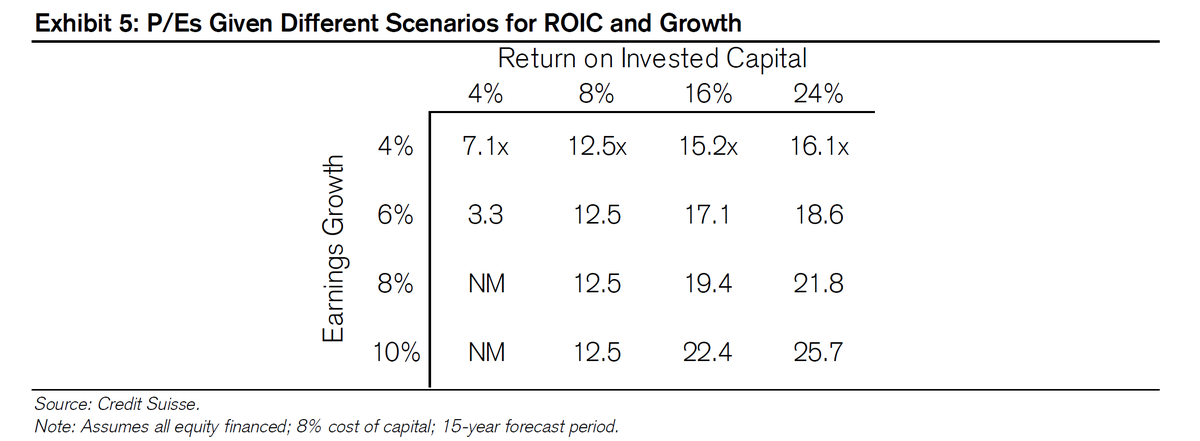
The second part of the value, the future growth, as per the formula depends on 1) the spread between ROIIC and WACC 2) the size of the investment 3) the duration of the positive spread
Investments that don't exceed the WACC are not value accretive and don't drive up the P/E
This is best seen in the below example, where only in the case where ROIIC exceeds the cost of capital (8%), is earnings growth accretive to value and thus deriving a higher multiple (at ROIIC of 8%, the business should be worth its steady state PE of 12.5x at any growth rate)
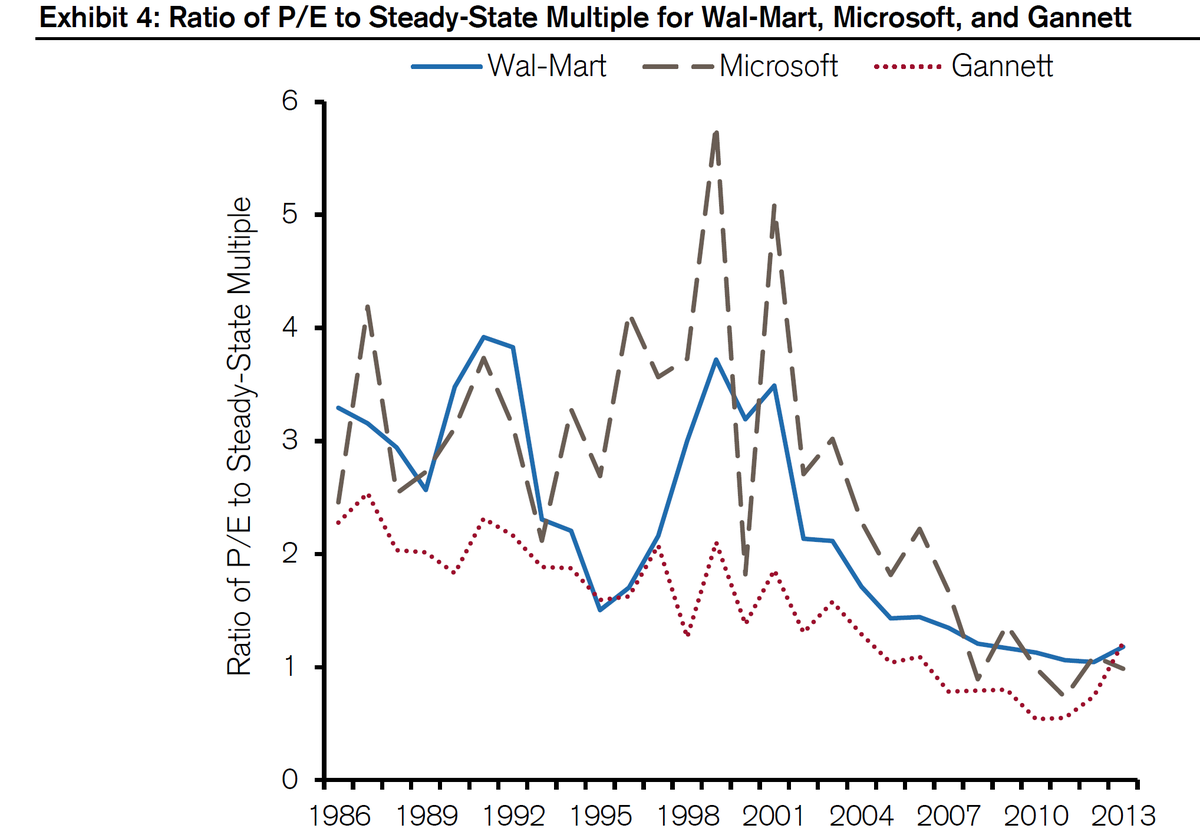
Competition will generally drive down ROIC to the CoE, meaning that a premium multiple is likely to move to the steady state multiple over time, as seen below in the P/Es for MSFT WMT GCI. The pace of the fade depends on a few factors incl. moat, investment runway, sector etc
Michael Mauboussin's 2014 paper on Calculating ROIC is an excellent guide to just about everything you need to know about this important metric and how to make sense of it. Here are my summary notes from reading it:
ROIC is a key indicator of a company's ability to create value, its competitive advantages and capital efficiency. What's important is: 1) the absolute spread between the ROIC and the WACC, and 2) how much capital can be deployed at that spread (reinvestment rate)
ROIC = NOPAT / Invested Capital (IC)
where NOPAT = EBIT - Cash taxes (ie. cash earnings before financing)
IC can be thought of in two ways: 1) the net assets a company needs to operate 2) the amount of financing a company's capital holders need to supply to fund the net assets
Very interesting data from Jefferies showing CPU and GPU instance share in the top cloud providers. Haven't come across this level of granularity before $NVDA $AMD $INTC
CPUs - clear trend of AMD taking share from Intel, but also AWS's Graviton being pushed strongly as well
Nvidia unsurprisingly dominates accelerator instances with over 80% share across all cloud providers, however interesting how much AWS is pushing its inferentia chip for inferencing workloads
Which means that Nvidia's share of AWS accelerated instances is falling and is the lowest amongst all the cloud providers (though still ~70%). Similar marginal share erosion happening at GCP with Google's TPUs, but to a lesser extent
$SE Overall a decent result given all the headwinds and tough comps. Some updated charts and KPIs that I track below along with some commentary:
Shopee GMV sequential decline was well expected by now but still 38% growth yoy and 64% rev yoy was a bit better than I expected. Take-rates flat qoq but these should see a nice increase next quarter as commissions have been raised across the board in the last few months
Good to see S&M per order reached its lowest level ever this quarter, although if i had to nickpick at anything it's the large increase in HQ costs which offset that somewhat, which meant total loss per order of $0.40 was largely flat.
The TLDR for those who want to cut straight to the summary at the end.
Feedback welcome as always.
The next article will cover Nvidia's expansion beyond the GPU, its software layer and full-stack computing approach, and competitive landscape.
If you enjoyed this, a retweet or a share would be greatly appreciated
$SE In my Garena deep dive last yr I used data from activeplayer.io to look at the popularity of FF & its peers. It estimates live players by scraping various sources. Here is the updated data on a time series basis. Interesting how well it correlates to bookings
Active players generally grew well over 1H'21 and then started falling, which ties to the slowdown/decline in bookings we saw in the Q3/Q4 results. Player numbers kept falling in the first 3m of this yr. PUBG and Fortnite are also down from their peaks but not to the same extent
This also ties well to SensorTower bookings (below), which show continued moderation in the first 3m of 22. Mgmt has obv incorporated this into the 22 guide but the big q is where will things normalise beyond this yr. Right now active players are still at around the 2H'20 levels
An excellent report from Bernstein on $SE addressing the key issues weighing on the stock right now - pathway to profitability, post-COVID slowdown, Free Fire, games pipeline, Tencent, and Krafton lawsuit. I am copying extracts in this thread as the detail is worth reading
A great breakdown of unit economics for Shopee showing the pathway to profitability 1) take rates increasing but importantly the high margin items of comms+ads - currently v. low but if that can increase to 50% of take rate in the outer years, GP % may go from c.10% today to 50%
and 2) S&M needs to not blow out considerably from current level of $0.41/order (they assume $0.50 in FY26). Assuming this, they get EBIT breakeven by FY26 (I had EBITDA breakeven by FY25 in my deep dive). Important to track these KPIs to validate the biz model is working