
Our latest analysis of excess mortality is now out, covering all cause mortality to the end of June 2022, plus COVID-19 only mortality for July-Sept.
#COVID19Aus #excessdeaths
TLDR: +11,200 excess deaths in first half of 2022 (13%)
actuaries.digital/2022/10/06/cov…
#COVID19Aus #excessdeaths
TLDR: +11,200 excess deaths in first half of 2022 (13%)
actuaries.digital/2022/10/06/cov…
Our excess deaths are measured relative to pre-pandemic expectations of mortality.
Includes allowance for continuation of mortality improvement/decline for each cause of death.
Allows for changes in the size and age composition of the population.
Includes allowance for continuation of mortality improvement/decline for each cause of death.
Allows for changes in the size and age composition of the population.
Excess mortality in the month of June 2022 was again very high, almost as bad as January 2022.
Needed to change my y-axis for this one.
Needed to change my y-axis for this one.

Total excess deaths in June of 2,400 (16%):
- a lower share of excess deaths were due to COVID-19 (about a third, compared with 54% earlier in 2022);
- there were more flu deaths in June than predicted, reflecting an early flu season; we do not expect a bad flu year
- a lower share of excess deaths were due to COVID-19 (about a third, compared with 54% earlier in 2022);
- there were more flu deaths in June than predicted, reflecting an early flu season; we do not expect a bad flu year

- dementia deaths were much higher than predicted, possibly impacted by the reappearance of flu in the community and high COVID-19 cases in aged care homes in June;
- ischaemic heart disease and other causes also made a significant contribution.
- ischaemic heart disease and other causes also made a significant contribution.

In the six months to June, total excess of 11,200 deaths (13%):
- half due to COVID-19 (98 from long Covid)
- respiratory down, despite flu deaths in May and June
- deaths from all other causes significantly higher than predicted.
- half due to COVID-19 (98 from long Covid)
- respiratory down, despite flu deaths in May and June
- deaths from all other causes significantly higher than predicted.

Here's weekly deaths from COVID (doctor-certified only). About 200 per week in May and June.
For context, in Australia we have about 1,200 deaths from motor vehicle accidents PER YEAR.
For context, in Australia we have about 1,200 deaths from motor vehicle accidents PER YEAR.

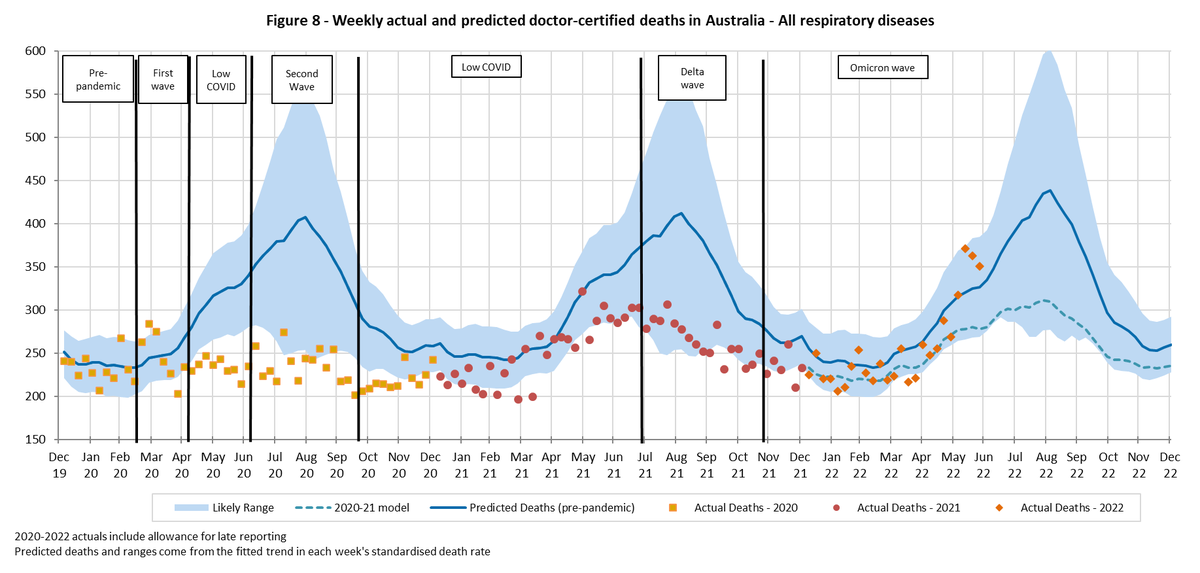
Here's weekly respiratory deaths (flu, pneumonia, chronic lower, other - not COVID).
Deaths were higher than predicted in June - a first since March 2020.
Flu surveillance indicates this is due to an earlier flu season rather than an indication of excess mortality for the year.
Deaths were higher than predicted in June - a first since March 2020.
Flu surveillance indicates this is due to an earlier flu season rather than an indication of excess mortality for the year.
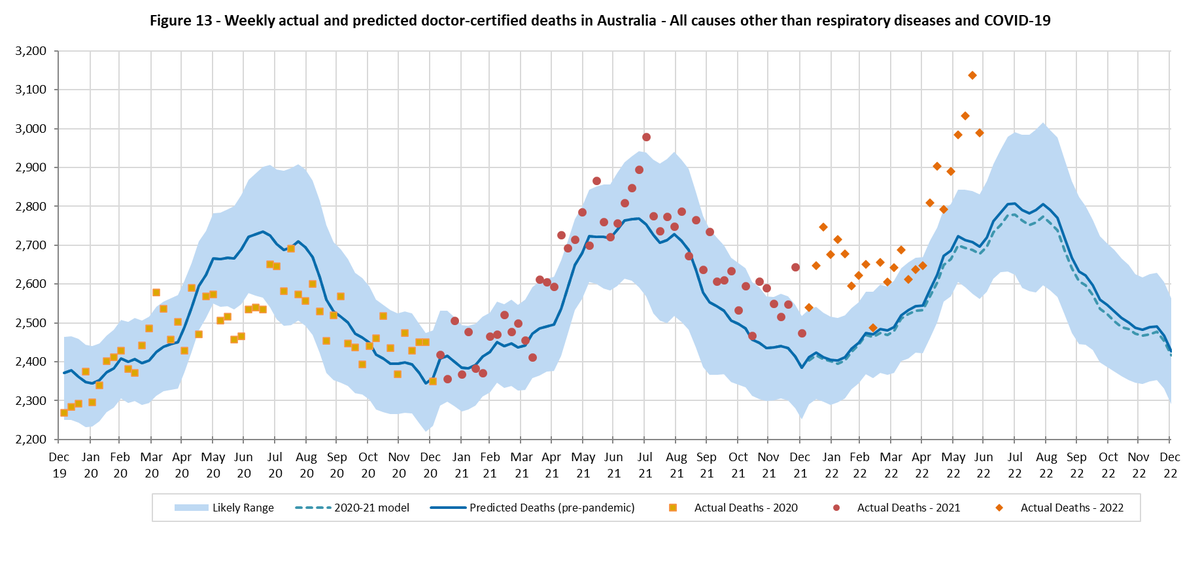
Here's all non-Covid, non-respiratory.
Another one where I needed to change my y-axis. Terrible.
Another one where I needed to change my y-axis. Terrible.
This shows the excess before and after removing deaths "with" Covid.
It is unclear how many people with COVID-19 would have died during this period anyway, and how many may have had their death hastened by COVID-19.
Thus, the table may ...
It is unclear how many people with COVID-19 would have died during this period anyway, and how many may have had their death hastened by COVID-19.
Thus, the table may ...

... overstate the contribution of COVID-19 to excess mortality from other causes.
However, it indicates that after removing with COVID-19 deaths:
•there remains significant excess from heart disease, dementia and other diseases; but
•excess for diabetes is very low.
However, it indicates that after removing with COVID-19 deaths:
•there remains significant excess from heart disease, dementia and other diseases; but
•excess for diabetes is very low.

This shows the breakdown of excess deaths into those due to COVID-19, those from COVID-19, and those where COVID-19 was not a cause listed on the death certificate.
June 2022 has the highest number of excess deaths not involving COVID-19.
June 2022 has the highest number of excess deaths not involving COVID-19.

What could be causing the non-COVID excess?
Multiple factors are likely in play, and different factors may be more or less pronounced at various times.
The blog in my first tweet discusses these potential factors in more detail.
Multiple factors are likely in play, and different factors may be more or less pronounced at various times.
The blog in my first tweet discusses these potential factors in more detail.

What about beyond June?
In the last three months there have been about 5,300 surveillance COVID deaths (including an estimate for the last 1-3 days of Sept).
In the last three months there have been about 5,300 surveillance COVID deaths (including an estimate for the last 1-3 days of Sept).

Of these, we expect 74% to be "from" rather than "with" COVID, resulting in a estimated 3,900 deaths from COVID-19 in Q3 2022. Equivalent to 8% excess, before we include any excess from other causes.

Estimated excess deaths across the pandemic are 13,800 (3%).

This shows the cumulative age standardised mortality rates for each year since 2015, expressed relative to the 2019 year.
Noting that, pre-pandemic, mortality was falling by 1.5%-2% pa, experience for the first half of 2022 is higher than for any other year shown.
Noting that, pre-pandemic, mortality was falling by 1.5%-2% pa, experience for the first half of 2022 is higher than for any other year shown.

Covid is expected to be the third leading cause of death in 2022. Behind dementia and ischaemic heart disease. Above strokes, lung cancer, colon cancer.

The end. Any questions?
Pre-emptively, no, we cannot do good analysis by age or state as we dont have data by age&cause or state&cause. So it makes it hard to interpret.
Here's a thread from last month on age, and I'll do something by state this month.
Pre-emptively, no, we cannot do good analysis by age or state as we dont have data by age&cause or state&cause. So it makes it hard to interpret.
Here's a thread from last month on age, and I'll do something by state this month.
https://twitter.com/KarenCutter4/status/1567713327148838912?s=20&t=n-UxaHj2NUD_PIu1T2ZNDQ
And congratulations if you got this far - it was a long one this month.
• • •
Missing some Tweet in this thread? You can try to
force a refresh


