The new #SAT report is out.
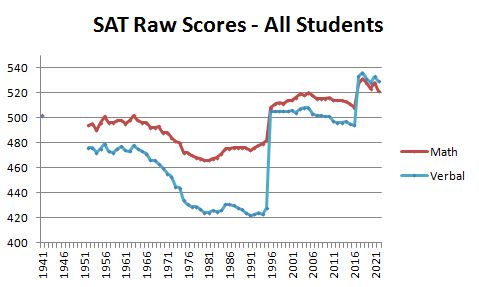
- Every racial group had a composite SAT score drop, except Native Americans (up 9 points) & those who did not respond on race
- Every racial group had a participation increase
- Men & women both increased participation 15% & lowered scores 11 points
- Every racial group had a composite SAT score drop, except Native Americans (up 9 points) & those who did not respond on race
- Every racial group had a participation increase
- Men & women both increased participation 15% & lowered scores 11 points

The reformed verbal/critical reading section is maintaining its scores as well as the math section, so far, unlike previous versions of the SAT. 

Citizenship is no longer reported, but English-only students dropped to the level of English-as-a-2nd-language students. However, students who didn't give their language took the SAT more than ESL students for the 1st time in 2022, while these non-responders' scores plummeted. 

The apparent partial recovery of Native-American scores doesn't seem to be directly linked to their drug mortality crisis, which rapidly worsened over the past 2 years.
#NativeAmericanCrisis


#NativeAmericanCrisis
https://twitter.com/JAMANetworkOpen/status/1572375053291094016


The new #ACT report is out.
- Every racial group increased participation, except African Americans.
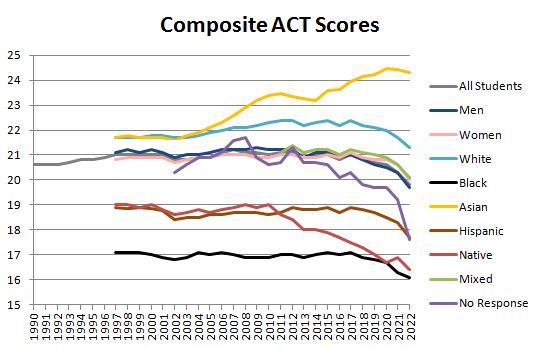
- Every racial group had lower ACT scores, and these were record lows, except for Asians.
- Women surpassed men in 2016, and the gap since then remains at the record of 0.3 points.
- Every racial group increased participation, except African Americans.
- Every racial group had lower ACT scores, and these were record lows, except for Asians.
- Women surpassed men in 2016, and the gap since then remains at the record of 0.3 points.

Though participation on the ACT & SAT are far from pre-lockdown peaks, SAT participation is recovering more successfully. Native-American ACT participation is still very low, which hasn't benefited their composite scores. Their SAT participation is up, with their score recovery. 


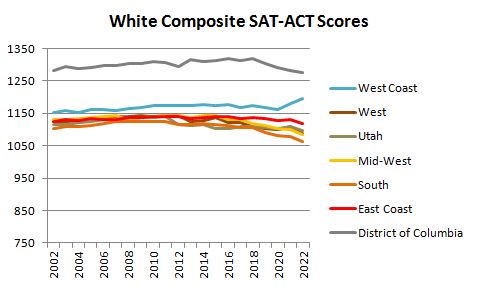
SAT/ACT composite scores improved in West Coast states for every racial demographic. Scores in the South and non-coastal West went down. 


The higher performance of West Coast states coincided with California displacing Massachusetts as the most improved SAT/ACT state over 20 years for whites and Asians. Whites in Michigan, the worst state for whites, continued to decline. 


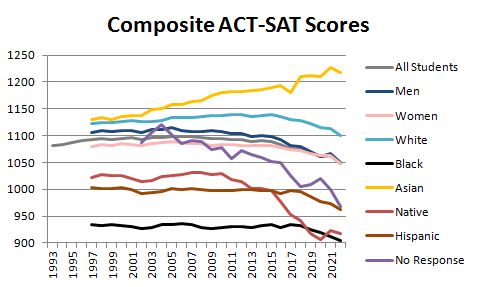
Native-American SAT scores show some improvement, while their ACT scores still decline. The ACT scores can be converted and combined with SAT data to show a flattening out of the Native-American decline in recent years. 

• • •
Missing some Tweet in this thread? You can try to
force a refresh


