Chancellor @KwasiKwarteng has promised a 'fully costed plan to get debt falling in the medium-term’.

But stabilising debt as a fraction of national income in 2026–27 would require a fiscal tightening of around £60bn on @Citibank’s central forecast.

[#IFSGreenBudget THREAD: 1/8]
Debt in our central forecast with @Citibank continues to rise throughout the forecast horizon, even once the big packages of support for rising energy prices are assumed to have expired.

[2/8] Chart shows forecast underlying public sector net debt. Titl
Even once these support packages expire, tax cuts and a weak economic outlook would keep borrowing high.

While there’s uncertainty around the scale, under a central forecast in 2026–27 we expect borrowing of around £100bn, around £70bn higher than forecast in March.

[3/8] Chart shows forecast borrowing. Title states: "Large pe
We forecast spending on debt interest will be around £100bn next year, double @OBR_UK's March forecast (itself already an £13bn upwards revision).

This increase would partly dissipate if inflation falls back, but higher interest rates & debt levels will push up spending.

[4/8] Chart shows spending on debt interest in £ billion. Title s
Rising inflation is eating into departmental spending plans set out a year ago, but the government has stated that it will leave them unchanged despite rising pressures.

Making big additional cuts to already squeezed departments to stabilise debt would be far from easy.

[5/8]
More growth would reduce the scale of fiscal tightening needed to stabilise debt.

But even if growth turned out to be 0.25 percentage points a year stronger than @Citibank expects, a fiscal tightening of around £40bn would be required to stabilise debt by 2026-27.

[6/8] Chart shows the trade-off between changes to taxes/benefits
The renewed focus on growth is welcome, but @OBR_UK has not historically incorporated hoped-for growth improvements into forecasts without concrete evidence of stronger growth.

Plans which rely on an unlikely uptick in growth are unlikely to impress financial markets.

[7/8]
“The Chancellor should not rely on over-optimistic growth forecasts or promises of unspecified spending cuts. To do so would risk his plans lacking the credibility which recent events have shown to be so important.”

Read our #IFSGreenBudget chapter> ifs.org.uk/publications/o…
[8/8] Quote from IFS Director Paul Johnson: "The UK governmen

• • •

Missing some Tweet in this thread? You can try to force a refresh
 

Keep Current with Institute for Fiscal Studies

Institute for Fiscal Studies Profile picture

Stay in touch and get notified when new unrolls are available from this author!

Read all threads

This Thread may be Removed Anytime!

PDF

Twitter may remove this content at anytime! Save it as PDF for later use!

Try unrolling a thread yourself!

how to unroll video
  1. Follow @ThreadReaderApp to mention us!

  2. From a Twitter thread mention us with a keyword "unroll"
@threadreaderapp unroll

Practice here first or read more on our help page!

More from @TheIFS

Oct 6
NEW: For every £1 given to households through the high-profile cuts to taxes, £2 is being taken away in the stealthy freezes to tax and benefit thresholds.

Read @TomWatersEcon and Tom Wernham’s @NuffieldFound-funded #IFSGreenBudget chapter> ifs.org.uk/publications/r…

THREAD: [1/8]
Alongside the headline tax cuts (to the basic rate of income tax & NICs) various thresholds and amounts in the tax-benefit system are being frozen.

This is raising the tax burden and reducing the size of the benefit system in real terms – especially when inflation is high [2/8]
Households in every part of the income distribution will, on average, lose more from freezes over the next three years than they will gain from the headline cuts.

The combined impact of freezes and headline cuts is broadly regressive. [3/8]
Read 8 tweets
Sep 21
NEW: In the absence of official scrutiny from @OBR_UK alongside Friday's announcement, we've provided our own #IFSGreenBudget fiscal forecasts with @citibank.

We find that planned tax cuts with stalling economic growth would leave debt on an unsustainable path.

THREAD: 1/13
It is disappointing that Friday’s statement won't be accompanied by new official forecasts from @OBR_uk.

These would have shown that a combination of a weaker outlook for the economy and substantial tax cuts will lead to more borrowing and more debt.

[2/13] An image of a section of a written quote from report author
.@Citibank’s forecasts show an improved outlook for economic growth from the @bankofengland’s August forecast.

But it is still a far worse performance than forecast by @OBR_uk in March.

[3/13] A chart with three lines with title 'The outlook for real gr
Read 13 tweets
Aug 16
NEW: Inequalities by family background emerge early and persist as children progress through the education system.

@ckfarquharson, @Sandra_McNally & Imran Tahir’s findings from our IFS Deaton Review chapter on education inequalities, funded by @NuffieldFound, in a thread:
[1/12] Chart shows attainment gaps between students eligible and no
The disadvantage gap at GCSE between children eligible for free schools meals and other children has barely changed over the past 20 years, despite decades of policy attention.

[2/12] Chart shows GCSE performance by children’s eligibility for
There is a direct link between family household income and children’s educational attainment.

Only 25% of children from the poorest tenth of households got five good GCSEs including English and maths, compared to 71% of pupils from the richest tenth.

[3/12] Chart shows GCSE attainment by decile of household income at
Read 13 tweets
Aug 15
NEW: £12 billion more in support for households needed just to maintain the value of the support package announced in May.

Read our IFS Green Budget briefing on the urgent need for clarity on strategies to support households, funded by @NuffieldFound> ifs.org.uk/publications/1…
The poorest fifth of households will face an eye-watering inflation rate of almost 18% inflation this October, compared to 11% for the richest fifth.

This is because poorer households spend more as a proportion of their budgets on energy. Chart shows expected inflation by income quintile in October
Rising inflation means that households who were set to see their incomes maintained or increased by the support measures, including those on the National Living Wage and out-of-work single parents with two children, are now expected to see real-term income falls this year. Chart shows changes in real take-home income, this year (202
Read 5 tweets
Aug 2
NEW: School spending per pupil in 2024 will still be 3% below 2010 levels once you account for the unexpectedly high cost pressures facing schools.

Read @lukesibieta’s briefing on the coming cost crunch for schools, funded by @Nuffieldfound> ifs.org.uk/publications/1…
[THREAD: 1/5] Chart shows real-terms trends in school spending per pupil,
Salaries for most teachers in 2022 will be about 12% lower in real terms than in 2010.

Despite planned salary increases, most are still likely to see real-terms cuts to pay this year. Teacher starting salaries will still be more than 3% lower in real terms than in 2010.

[2/5] Chart showing real-terms changes over time in teacher salary
School costs are expected to grow by 6% this year. This should be just about affordable, as the overall growth in funding per pupil is 7.7%.

But in 2023-24 schools will face real-terms cuts, as the growth in funding per pupil will likely fall below growth in school costs.

[3/5] Chart shows estimated increase in school costs over time by
Read 5 tweets
Jul 6
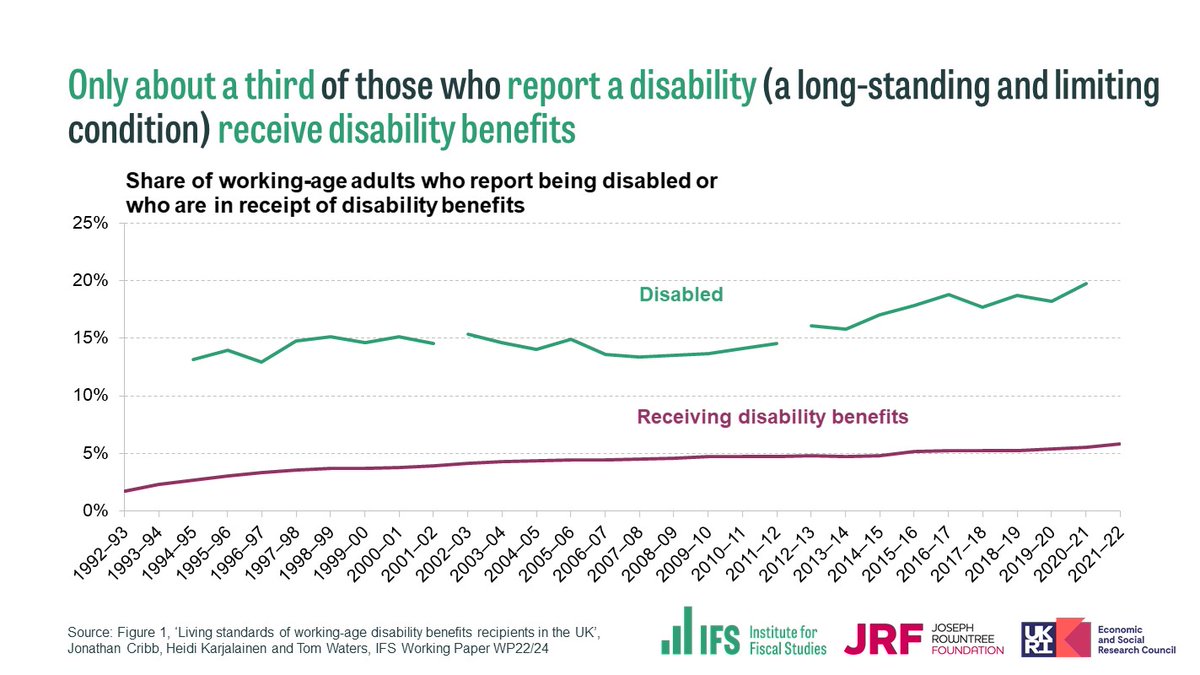
The share of working-age people claiming disability benefits has increased from 2% to 6% since 1992.

But only about a third of those who report a disability (a long-standing, limiting condition) receive disability benefits.

[THREAD: 1/7] @jrf_uk
ifs.org.uk/publications/1… Chart showing the share of working-age adults who report bei
The change from disability living allowance (DLA) to personal independence payment (PIP) was intended to reduce spending on disability benefits by 20%.

But since the reform spending has increased – even faster than prior to reform – and was £11bn per year pre-pandemic.

[2/7]
The growth in disability benefit claims has been primarily driven by an increased prevalence of mental health conditions.

Four-fifths of the rise in disability benefit recipients over the past two decades is accounted for by those with psychiatric conditions.

[3/7] Chart showing the main disabling condition among disability
Read 7 tweets

Did Thread Reader help you today?

Support us! We are indie developers!


This site is made by just two indie developers on a laptop doing marketing, support and development! Read more about the story.

Become a Premium Member ($3/month or $30/year) and get exclusive features!

Become Premium

Don't want to be a Premium member but still want to support us?

Make a small donation by buying us coffee ($5) or help with server cost ($10)

Donate via Paypal

Or Donate anonymously using crypto!

Ethereum

0xfe58350B80634f60Fa6Dc149a72b4DFbc17D341E copy

Bitcoin

3ATGMxNzCUFzxpMCHL5sWSt4DVtS8UqXpi copy

Thank you for your support!

Follow Us on Twitter!

:(