Vikrant Profile picture
Oct 11, 2022 7 tweets 5 min read Read on X
A thread 🧵

How to draw trendline & how its useful
In Technical analysis

Here it's application 👇
➡️It is formed when a diagonal line can be drawn between a minimum of three or more price pivot points.

And that all three points must tested equally.

example 👇 #sis Image
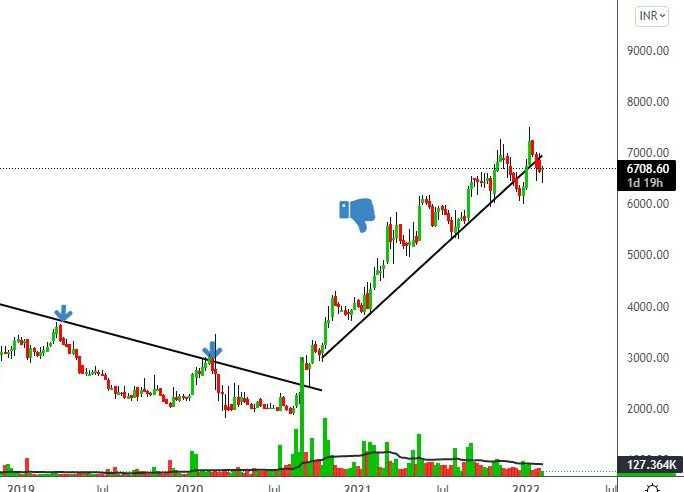
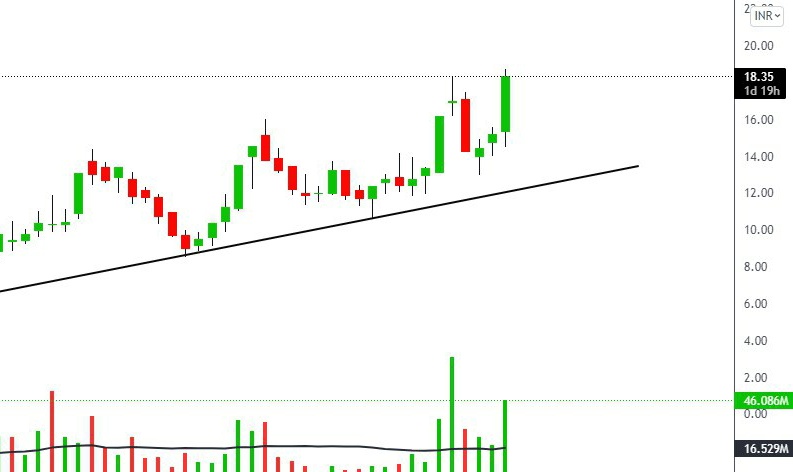
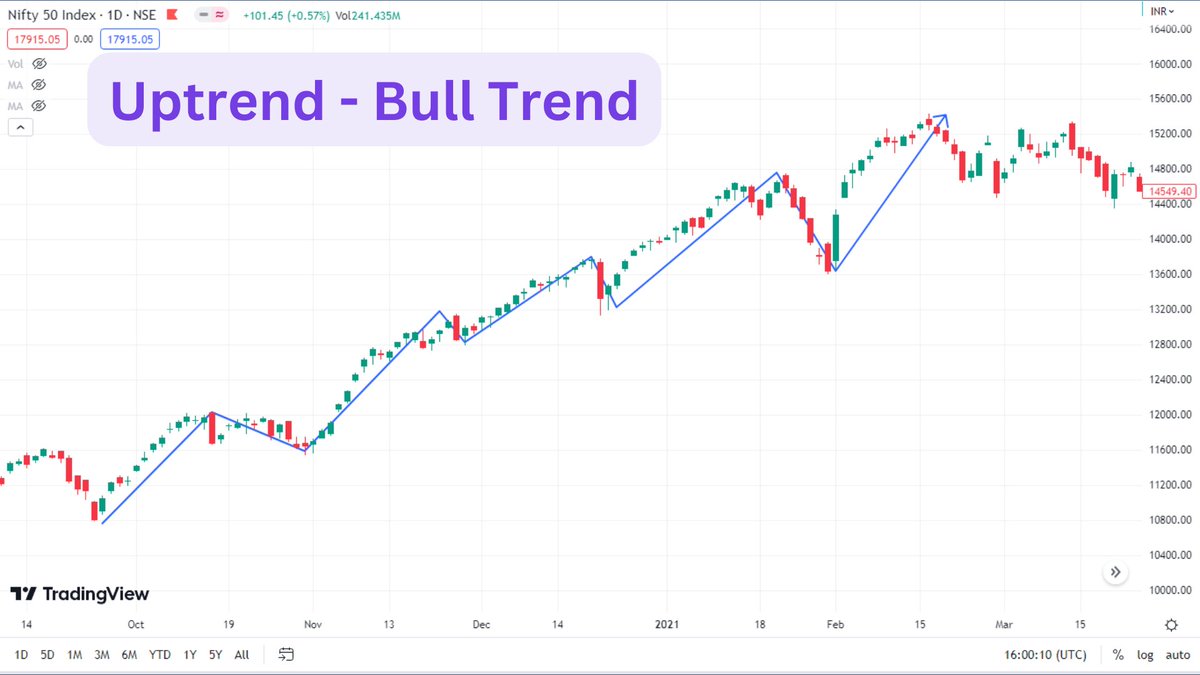
➡️ Trendline is mainly useful for identifying trend 👇

⚡Uptrend - #happiestmind

⚡Downtrend - #bluedart ImageImage
➡️ It's also act as support & resistance.

Ex - ⚡ #happiestmind

#omaxe ImageImage
➡️ If three point 📍have not be touched clearly then it is wrong ❌

Ex - ⚡ #bluedart

#zeemedia ImageImage
➡️ It is also useful big trend changing move 🚀

#godfryphilps is also consolidating from 7 years now it's trend going to change after trendline BO Image
Hope this thread helpful 🙏 to inhance ur knowledge 📚

For more learnings you can check my youtube videos 👇

You can also join my free telegram for daily updates 👇t.me/lifeandtrading…

• • •

Missing some Tweet in this thread? You can try to force a refresh
 

Keep Current with Vikrant

Vikrant Profile picture

Stay in touch and get notified when new unrolls are available from this author!

Read all threads

This Thread may be Removed Anytime!

PDF

Twitter may remove this content at anytime! Save it as PDF for later use!

Try unrolling a thread yourself!

how to unroll video
  1. Follow @ThreadReaderApp to mention us!

  2. From a Twitter thread mention us with a keyword "unroll"
@threadreaderapp unroll

Practice here first or read more on our help page!

More from @Trading0secrets

Aug 11, 2024
Full #Volume Analysis Thread🧵

One thing which Big player can never hide - VOLUME

This indicator used by every Price Action Trader.
Volume price interpretation -
🔸price increases + volume increases = Bull 🐂

🔸Price decreases + volume increases = Bear 🐻

🔸Price increases + volume decreases = Fake upmove) sideways

🔸Price decreases + volume decrease = Fake downmove) sideways
1⃣Always big breakout start with big VOLUME.

The higher the volume +higher the range = higher will be the move.

Ex- HUDCO Image
Read 10 tweets
Jun 21, 2024
You take a Big Profit trade at open

Price moved upside, & you made some profits After some time, the price started to come down

Now you don't know whether it is a TEMPORARY PULLBACK or a COMPLETE REVERSAL

4 Ways to know it. 🧵
1️⃣Look at Open Action

Open action (9.15-9.45) plays a crucial role in the day.

The presence of strong buyers indicates it is just a pullback.

The absence of strong buyers indicates a high possibility of reversal!
Image
Image
2️⃣Look at the Last 2 Days' Price Action

The last 2-3 days' market sentiment plays a crucial role in the current day.

If it is positive, then there is a high possibility that the price is just showing a temporary pullback (and not a complete reversal). Image
Read 6 tweets
Apr 27, 2024
My Trading Strategy. Cash Trading Strategy for Swing traders. I used this strategy for swing / momentum trades. Never miss it.

A Megha Thread 🧵
1️⃣ Stock Selection Process - Always choose that stock which are consolidating near All time high. (Because whenever stock will give ATH breakout then it will easily give 20/30% return in 1/2 months.
Use - Trading View/ Chartlink

Ex - NTPC Image
2️⃣ Volume Analysis - After stocks selection, We should do volume analysis. Volume more normal days . And last 3/4 month volume accumulation is much higher.

Ex - WABAG Image
Read 11 tweets
Dec 31, 2023
Multi-Year Breakout in PSU Stocks.
Those stocks are going to Break there ATH.👇

7 Stocks Thread 🧵.
✨SCI - 16 years Breakout.

Market Cap - 7,588 Cr.
Current Price - 163
Stock P/E - 8.5
ROCE - 10.5 %
ROE - 13.4 % Image
✨ MRPL - 16 years Breakout

Market Cap - 23,336 Cr.
Current Price - 133
Stock P/E - 6.16
ROCE - 20.1 %
ROE - 31.1 % Image
Read 9 tweets
Jul 8, 2023
Full divergence explantion by simple
Images 👇

1⃣ Momentum divergence
Read 4 tweets
Jun 10, 2023
ROE , ROCE , D/E and some important terms Simplified.

Vishal start a Business.
He started a biz with 10Lac. Thats equity.

To grow the business he took loan of 5Lac.

Total capital is 15 Lac
Lets calculate D/E of Vishal business.

D/E = Debt/equity.
Debt/equity = 5L/10L = 0.5

Vishal has 0.5X of debt to his equity.
Consider, in FY23 Vishal generated revenue of 25Lac.

After subtracting raw material cost, employee benefits, marketing cost he made 8 Lac.

So, 8 Lac is Ebitda (earning before interest, tax, depreciation and amortisation)
Read 14 tweets

Did Thread Reader help you today?

Support us! We are indie developers!


This site is made by just two indie developers on a laptop doing marketing, support and development! Read more about the story.

Become a Premium Member ($3/month or $30/year) and get exclusive features!

Become Premium

Don't want to be a Premium member but still want to support us?

Make a small donation by buying us coffee ($5) or help with server cost ($10)

Donate via Paypal

Or Donate anonymously using crypto!

Ethereum

0xfe58350B80634f60Fa6Dc149a72b4DFbc17D341E copy

Bitcoin

3ATGMxNzCUFzxpMCHL5sWSt4DVtS8UqXpi copy

Thank you for your support!

Follow Us!

:(