The SARS-CoV2 lineage soup was becoming a bit too complex to plot nicely, so here some simplified plots with lineages grouped by number of key mutations present, as suggested by @CorneliusRoemer (with some help from @rquiroga777). Image
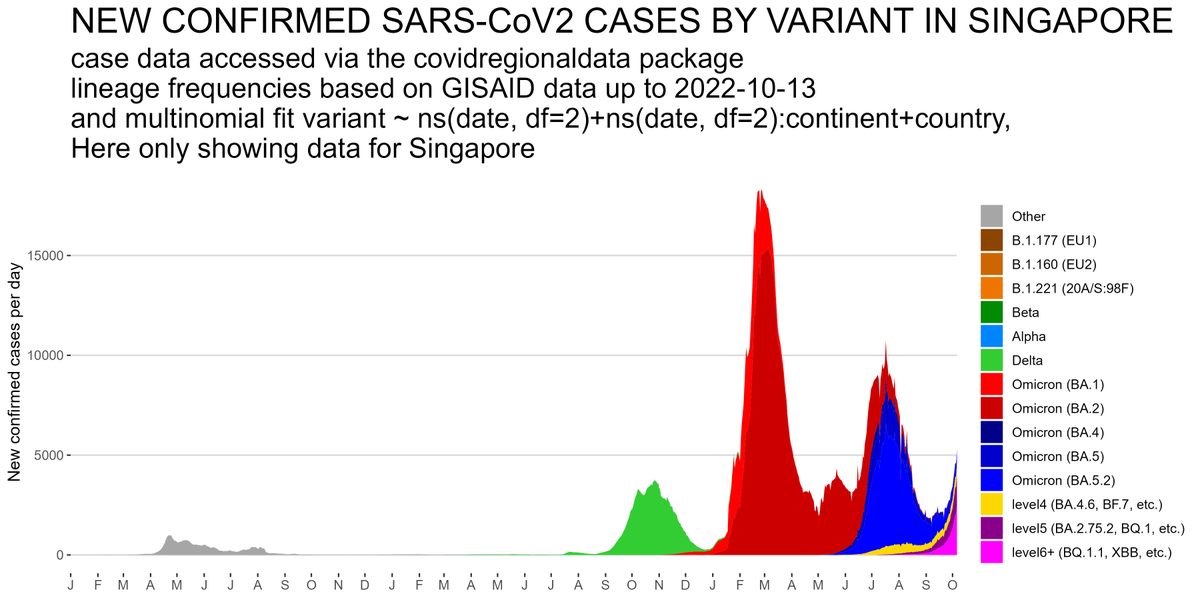
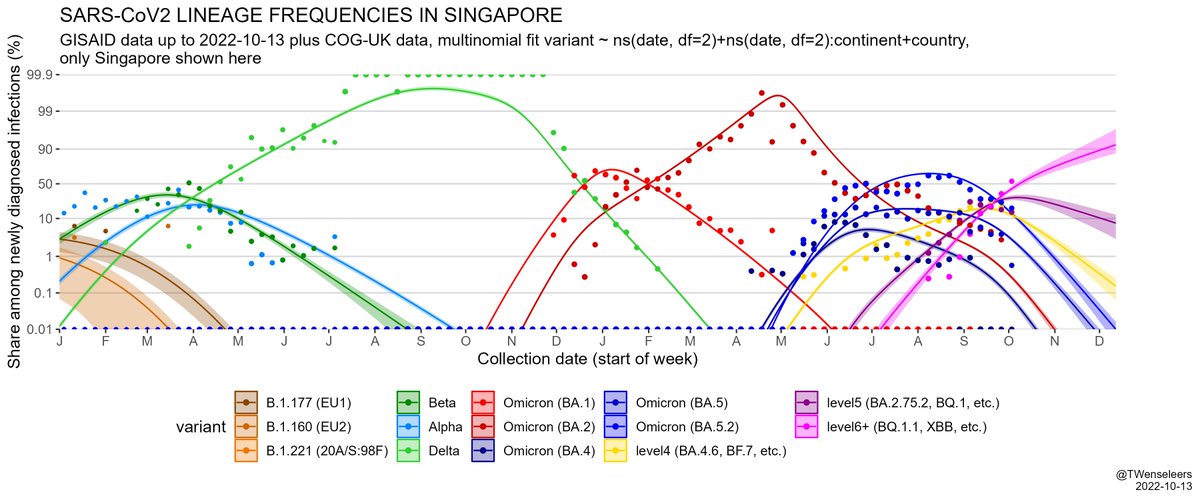
With the exception of Singapore, that is experiencing an XBB driven wave now, level6+ variants (BQ.1.1, XBB, etc) would appear to still be at a relatively low level & not to exert a lot of pressure on case nrs yet, but this might soon change,... Image
considering that the Omicron XBB variant is clearly driving up infections in Singapore... Image
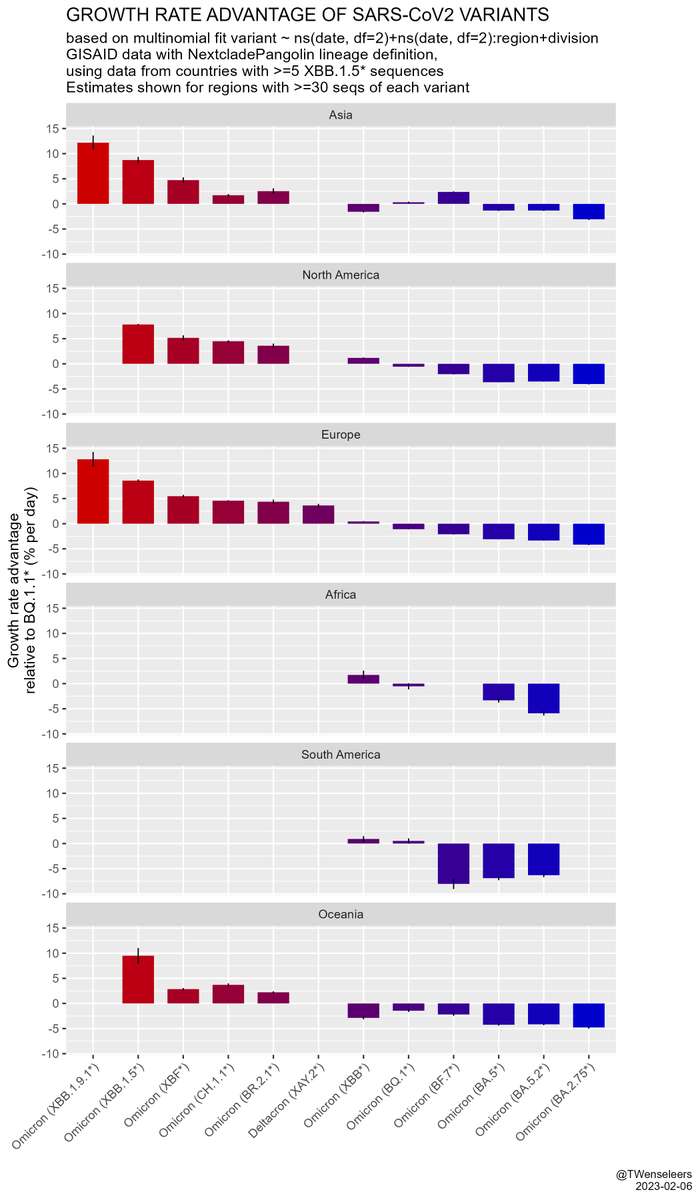
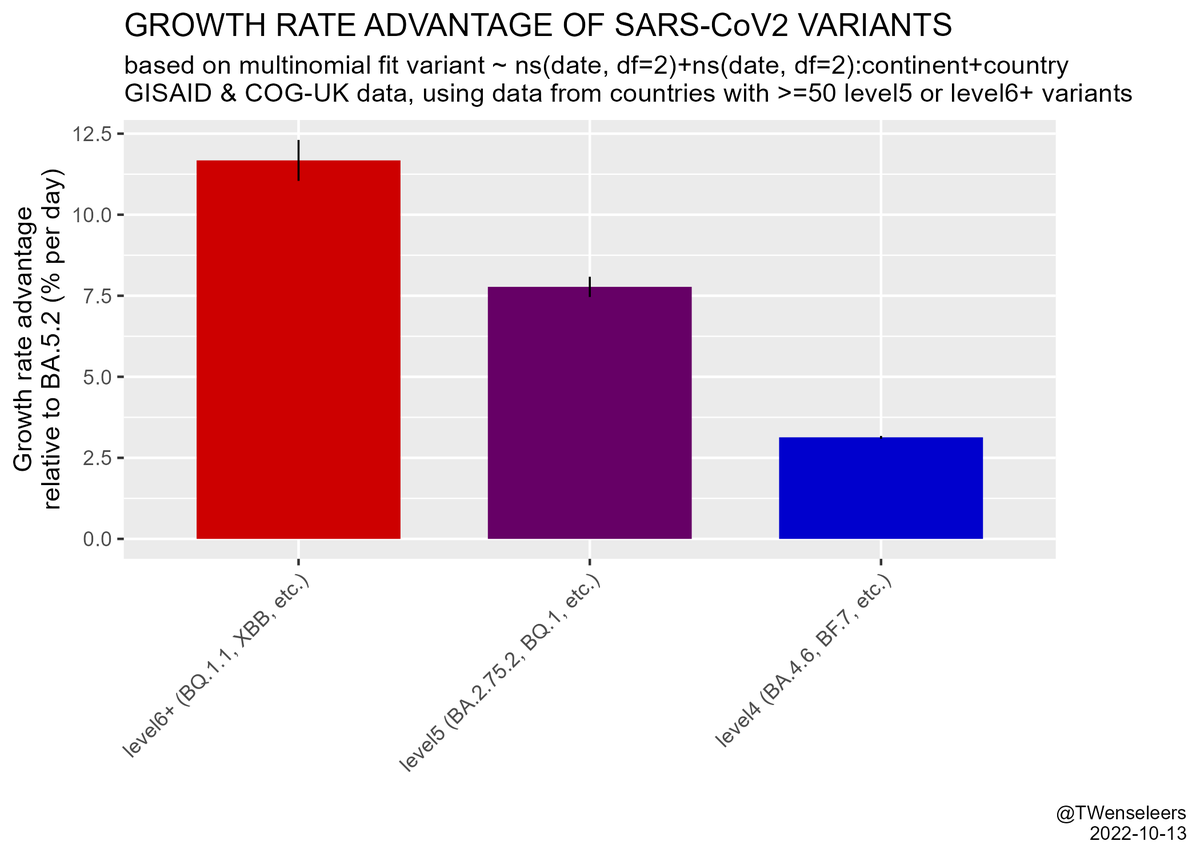
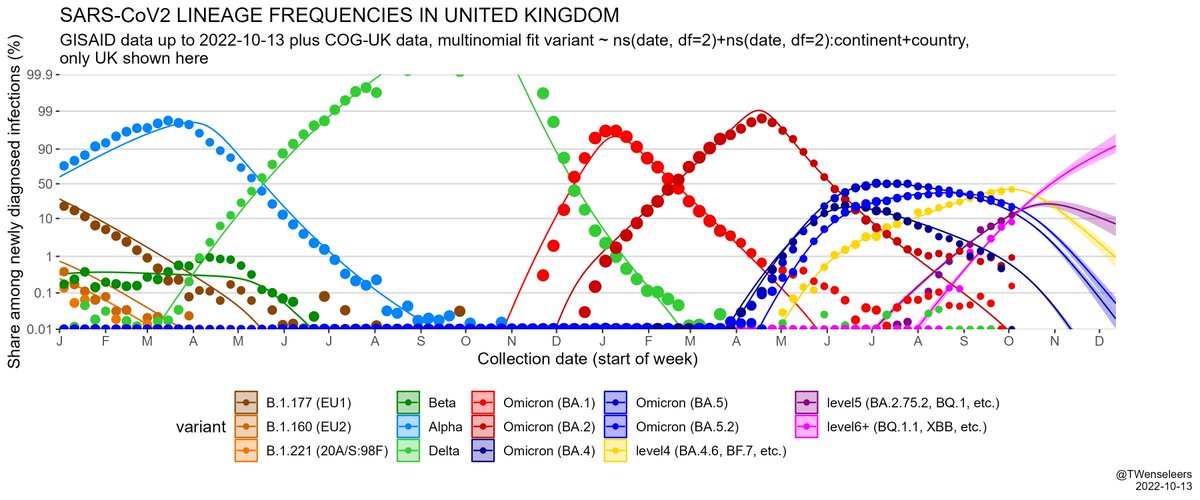
and that the estimated growth rate advantage of level6+ variants (BQ.1.1, XBB, etc) over resident type BA.5.2 is in excess of 10% per day. All this means a resurgence is likely later in November, even if cases currently start to flatten a bit... Image
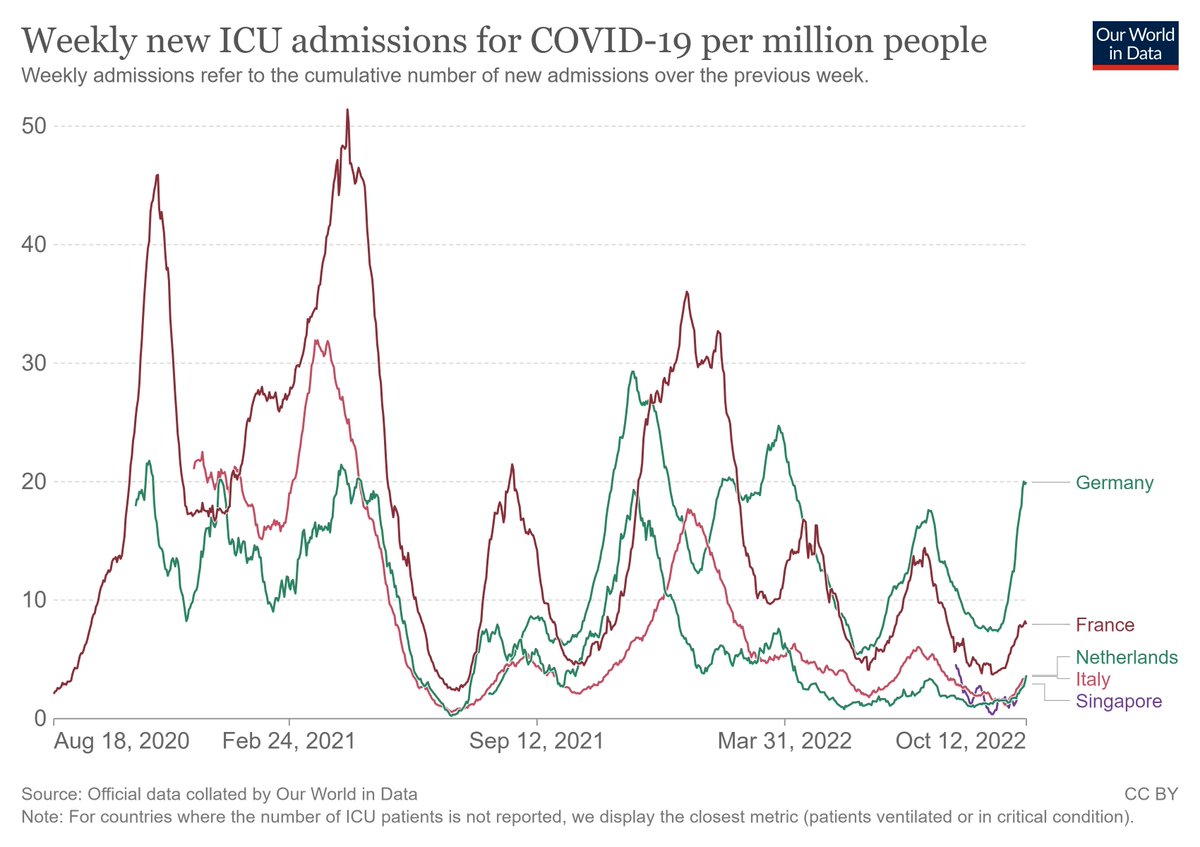
Western European countries are seeing rising hospital and ICU admissions, with especially Germany already seeing figures that are higher than expected. If you get your invitation for a booster it might be a good idea to go and get it... Image
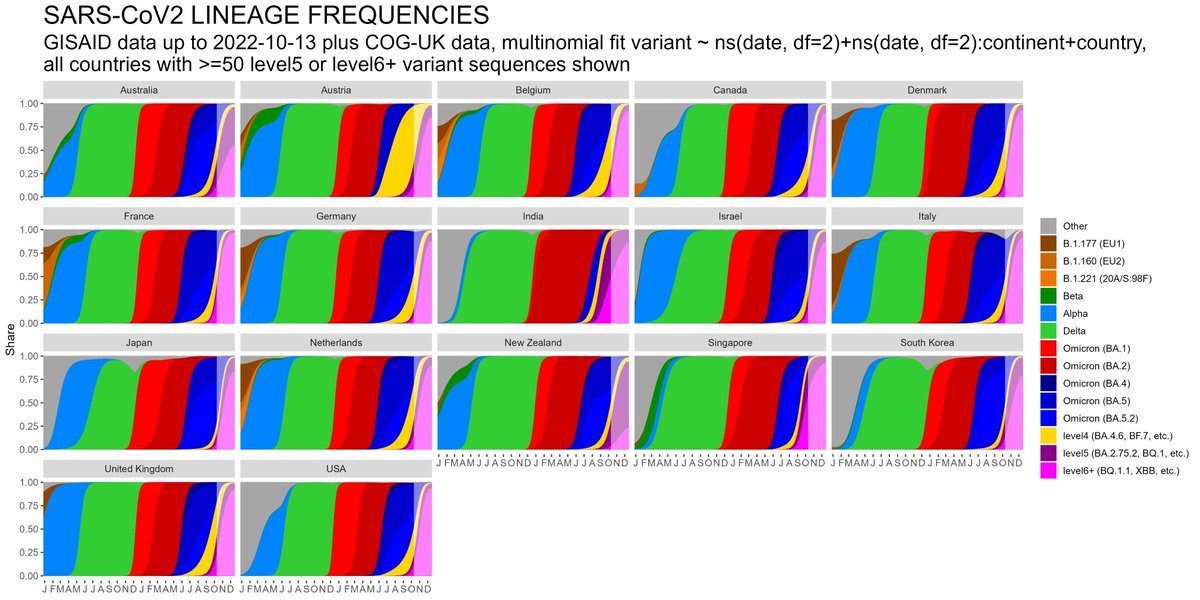
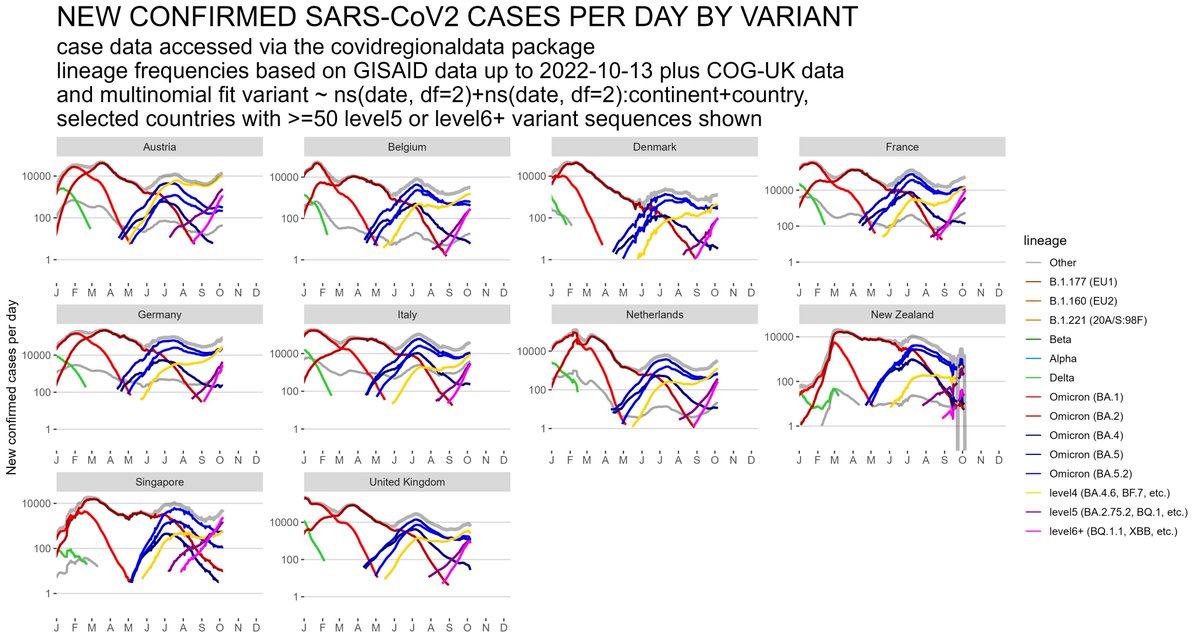
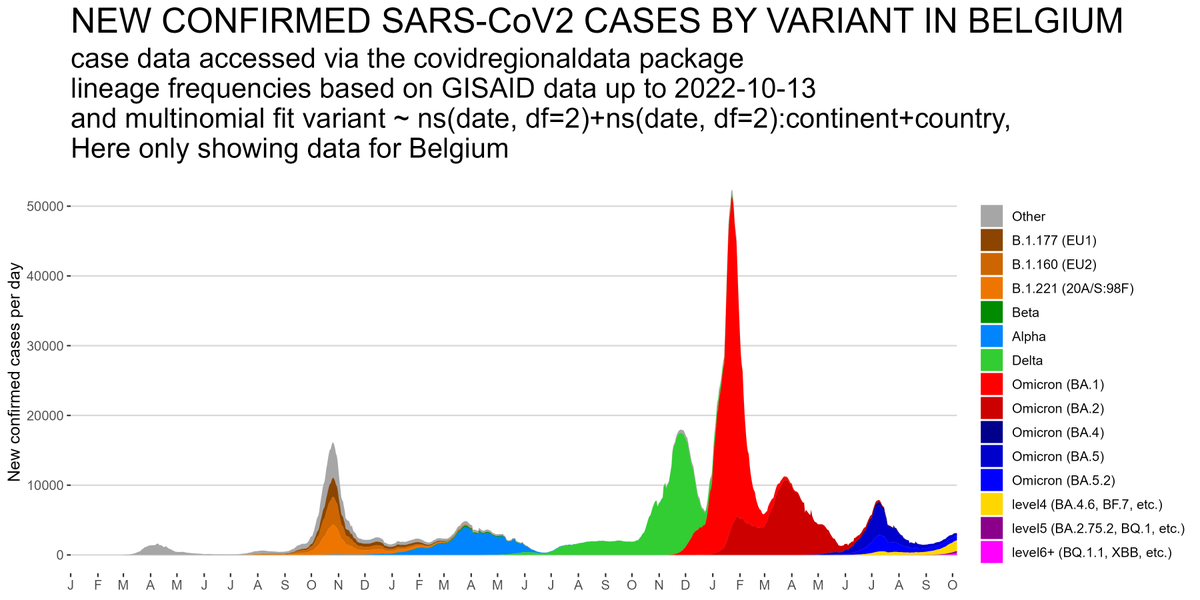
Here a plot of estimated cases by lineage in a few selected countries. Image
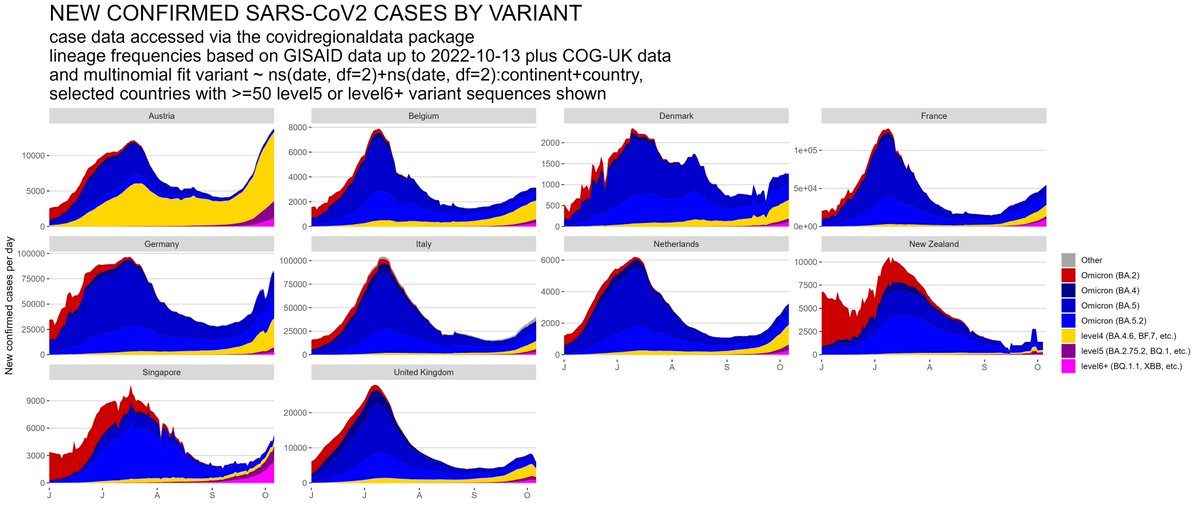
Here also shown as a stacked area chart. Image
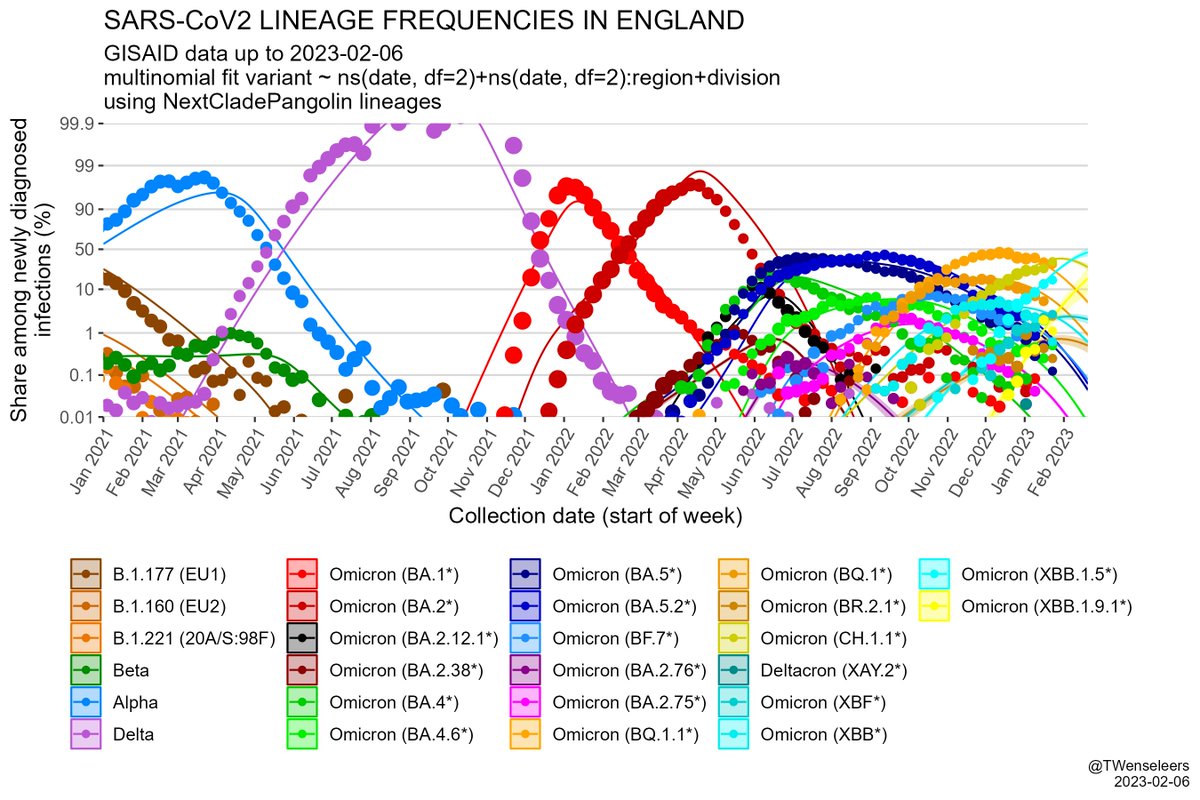
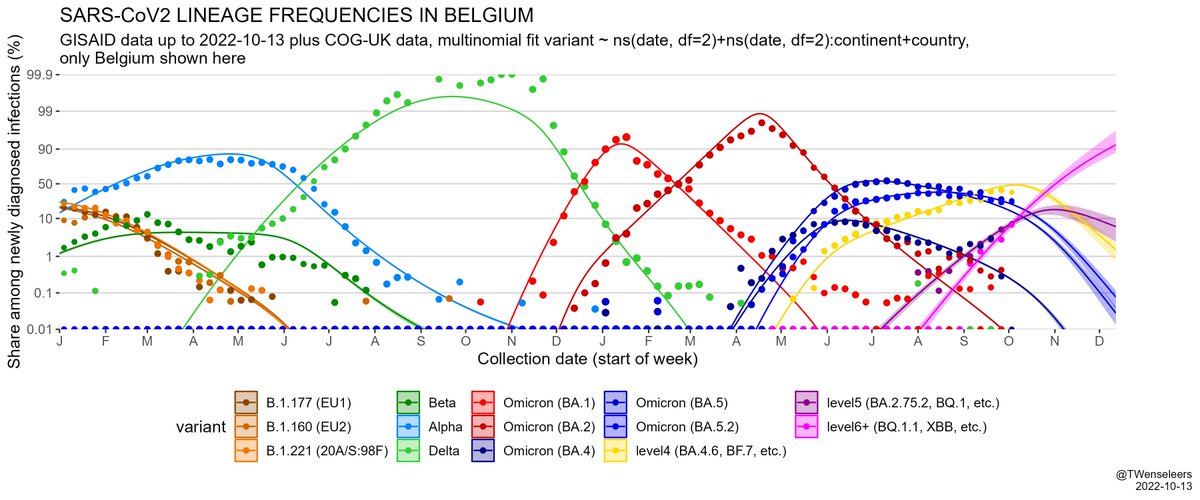
And estimated share of different variant lineages in a few countries: in the UK...
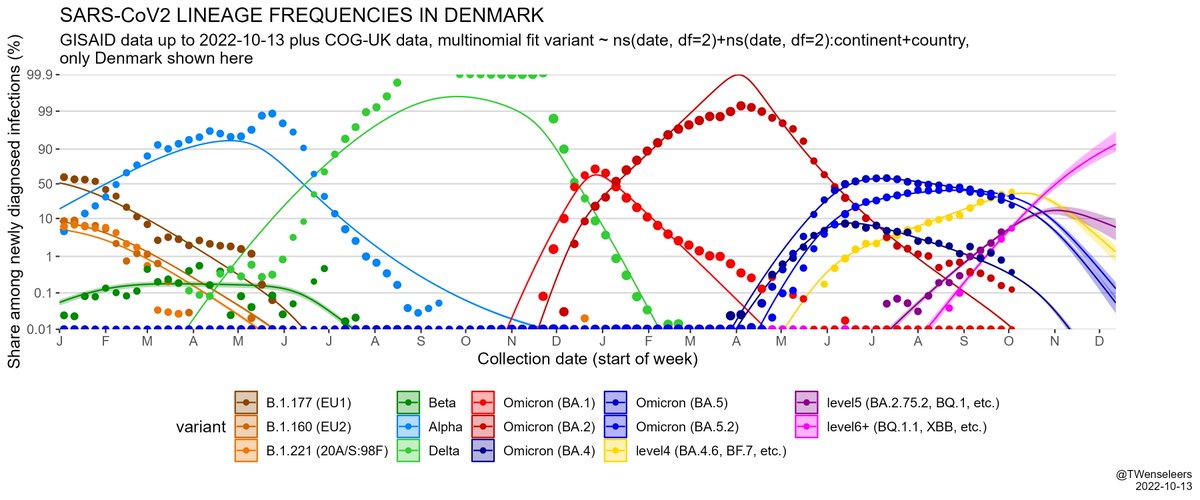
 Image
In Denmark... Image
In Austria... (this excudes pre-selected targeted sequencing)
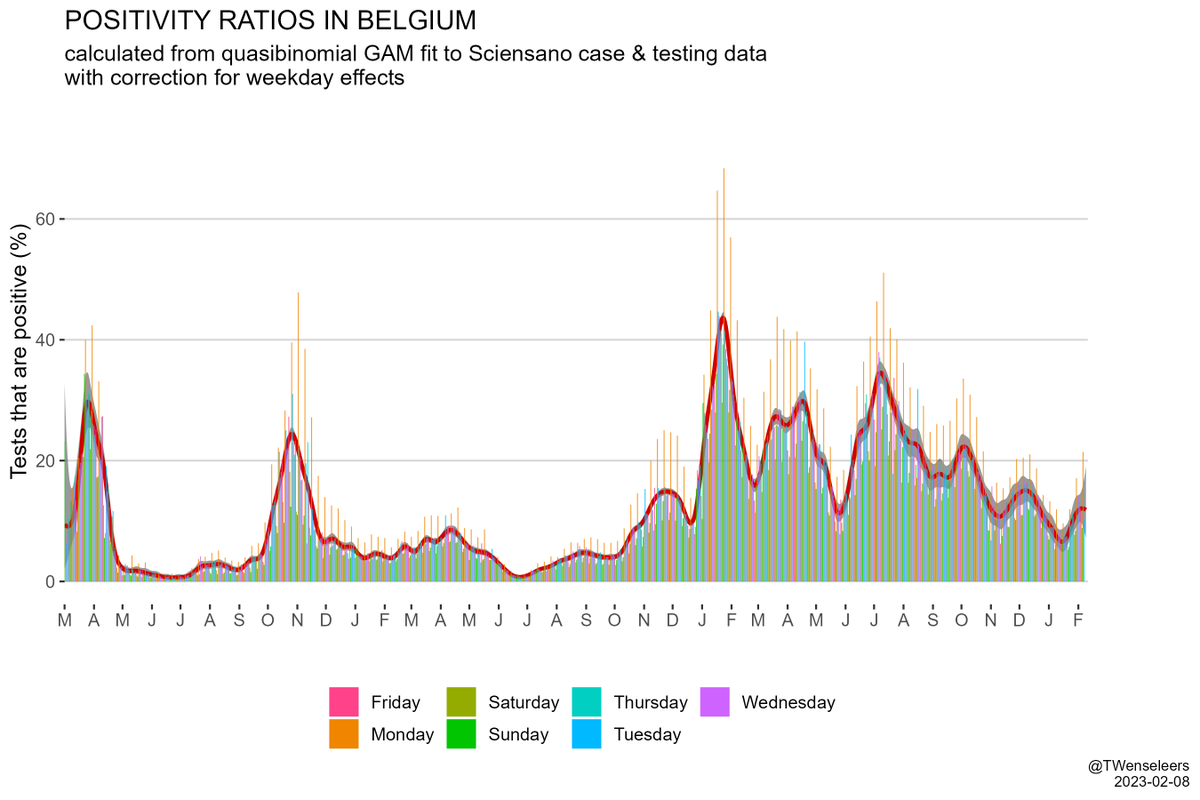
 Image
In Belgium... Image
And Singapore, where XBB has become dominant... Image
In W Europe, level 6+ lineages are still too rare to have much of an effect on case nrs - the resurgence we saw so far was mostly driven by waning immunity & a change in contact patterns. Only in Belgium BF.7 might have played some role as well. But effect of BQ.1.1 yet to come. Image
R code of plots & analysis of global @GISAID & @CovidGenomicsUK data can be found here: github.com/tomwenseleers/…. Some more plots can be found here github.com/tomwenseleers/….

• • •

Missing some Tweet in this thread? You can try to force a refresh
 

Keep Current with Tom Wenseleers now @twenseleers.bsky.social

Tom Wenseleers now @twenseleers.bsky.social Profile picture

Stay in touch and get notified when new unrolls are available from this author!

Read all threads

This Thread may be Removed Anytime!

PDF

Twitter may remove this content at anytime! Save it as PDF for later use!

Try unrolling a thread yourself!

how to unroll video
  1. Follow @ThreadReaderApp to mention us!

  2. From a Twitter thread mention us with a keyword "unroll"
@threadreaderapp unroll

Practice here first or read more on our help page!

More from @TWenseleers

Mar 22, 2023
So there was a bit of talk if the high SARS-Cov2 positivity found in the SW corner of the Huanan Market could be an artefact of a sampling bias. It is not. OK, a basic density plot of SARS-Cov2 positive samples is confounded by sampling intensity...🧵
But before the authors also calculate the relative risk to encounter SARS-CoV2 positive samples across the market & that gave the same conclusion...
A conclusion that is also further supported if one fits a binomial GAM 2D tensor spline to SARS-CoV2 positivity rates per stall. Same conclusion - samples taken in the SW corner of the market where wildlife products were being sold were more likely to test positive... Code here:
Read 7 tweets
Mar 22, 2023
Ha the good old "Western scientists re-analysing data from LMIC (or in this case even of an UMIC) is neocolonialist". Bollocks. It took over a year for Gao et al to share their fastq files... That's a reasonable referee request...
Especially since the original preprint included statements like a sample from a feather removal machine only containing human DNA and stuff like that.
Also completely ludicrous that a preprint that's been public for a year could not be criticised by Western scientists because it's still under review. By the looks of it it's still under review because of genuine problems in the analyses...
Read 4 tweets
Mar 22, 2023
"The reviewer, who asked not to be named, noted that the paper also includes an analysis of a sample from a defeathering machine at the market that found only human DNA. ‘Either only humans were defeathered or the analysis was wrong—pick your favorite’" science.org/content/articl…
Yes, this @sciencecohen article is from the 18th of August 2022, and is discussing the Gao et al. / Liu et al. preprint, researchsquare.com/article/rs-137…. When received by Nature, the referees said this analysis could not be published without providing the raw data.
Eventually it seems the raw FASTQ data were shared on @GISAID. Where - as one would hope - the data was independently scrutinized by others. Resulting in completely different conclusions (compare graph on the left with that on the right).
Read 7 tweets
Mar 21, 2023
And here the much awaited report of @flodebarre, @MichaelWorobey & @K_G_Andersen, based on a re-analysis of the Chinese CDC GISAID data (that recently were taken down again)! Seems pretty compelling to me! zenodo.org/record/7754299… Image
The evidence should even satisfy eternal contrarian @BallouxFrancois: there is a positive association between samples with high Sars-Cov2 read content & the ones containing raccoon dog reads. What more could one wish? Image
Or well, apparently not. Being on the sceptical side in the right dose can be healthy as a scientist. But at some stage being the eternal contrarian just becomes utterly tiring... ImageImage
Read 6 tweets
Feb 10, 2023
Amazing how SARS-CoV2 keeps on evolving. Since end of Jan Belgium started its 10th wave now - the latest one presumably driven by Omicron subvariants CH.1.1+XBB.1.5+XBB.1.9.1. Slower initial rate of increase in hosps for Covid than for BQ.1 Dec wave predicts smaller wave though.
When I say 10 I'm not counting 2 smaller waves in fact. So some might put it at 12. Two weeks ago this fit already detected a changepoint (ie growth in infections starting again).
The above uses increase in positivity ratios (% of tests that are Covid positive) on log(odds) scale as a proxy for rise in infections (correcting for weekday effects & bank holidays), which can be seen to track growth in hospitalisations pretty well (taking into account lags).
Read 13 tweets
Feb 6, 2023
In Indonesia, Omicron XBB.1.9.1 (yellow) now has a >50% share - one country at least that will skip an Omicron XBB.1.5 wave (cyan) - not because it didn't have an advantage there, but because another even fitter variant emerged. Second is Singapore, where XBB.1.9.1 has 15% share.
Also in England XBB.1.9.1 is taking off fast...
Here the inferred growth advantage of XBB.1.9.1 & XBB.1.5 over BQ.1.1*. XBB.1.9.1 ahead of the pack. It has identical spike than XBB.1.5 (convergently evolved), but 2 fitness enhancing amino acid changes in ORF1a & 1 AA change in ORF9b. Code at github.com/tomwenseleers/…
Read 5 tweets

Did Thread Reader help you today?

Support us! We are indie developers!


This site is made by just two indie developers on a laptop doing marketing, support and development! Read more about the story.

Become a Premium Member ($3/month or $30/year) and get exclusive features!

Become Premium

Don't want to be a Premium member but still want to support us?

Make a small donation by buying us coffee ($5) or help with server cost ($10)

Donate via Paypal

Or Donate anonymously using crypto!

Ethereum

0xfe58350B80634f60Fa6Dc149a72b4DFbc17D341E copy

Bitcoin

3ATGMxNzCUFzxpMCHL5sWSt4DVtS8UqXpi copy

Thank you for your support!

Follow Us!

:(