
Views my own & tweeting in my own name
Also at @twenseleers.bsky.social
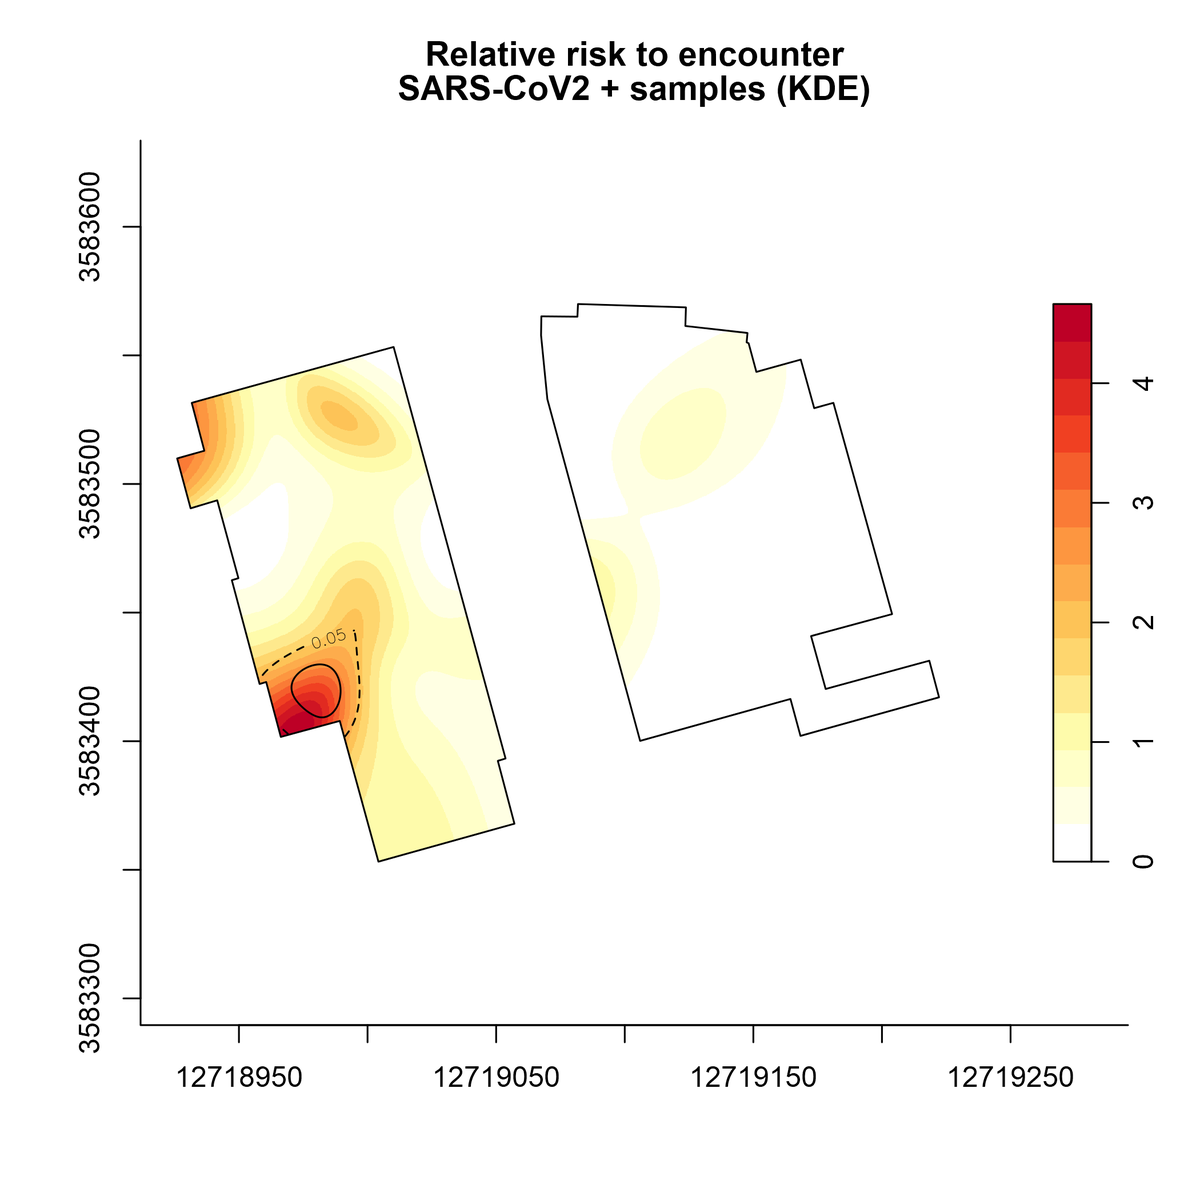
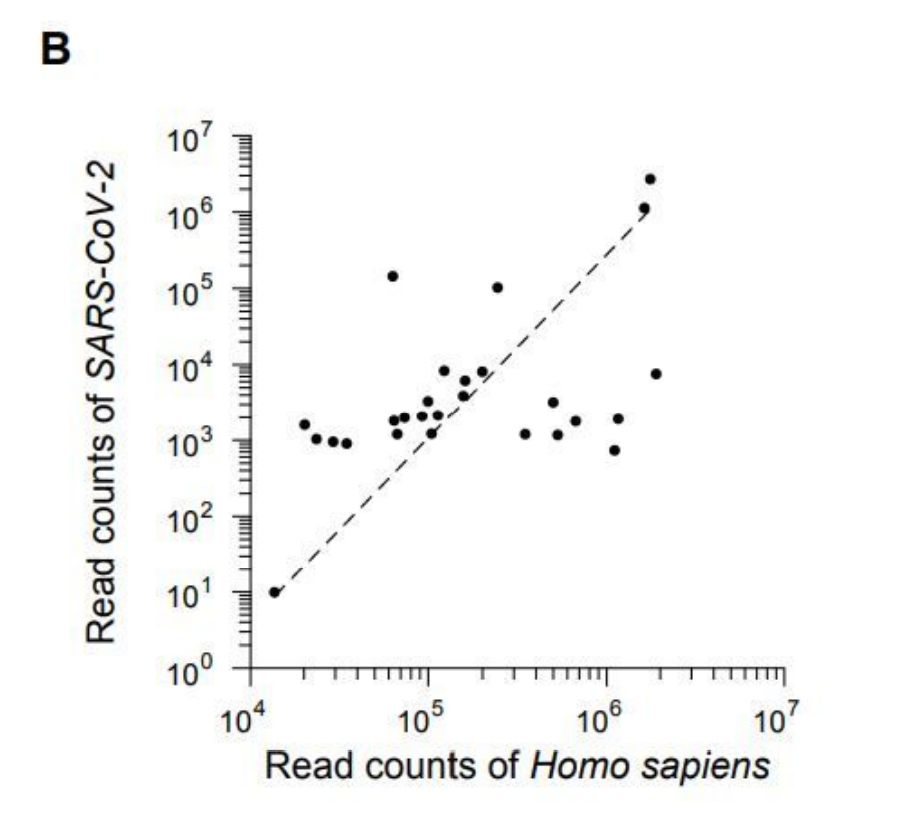
 The evidence should even satisfy eternal contrarian @BallouxFrancois: there is a positive association between samples with high Sars-Cov2 read content & the ones containing raccoon dog reads. What more could one wish?
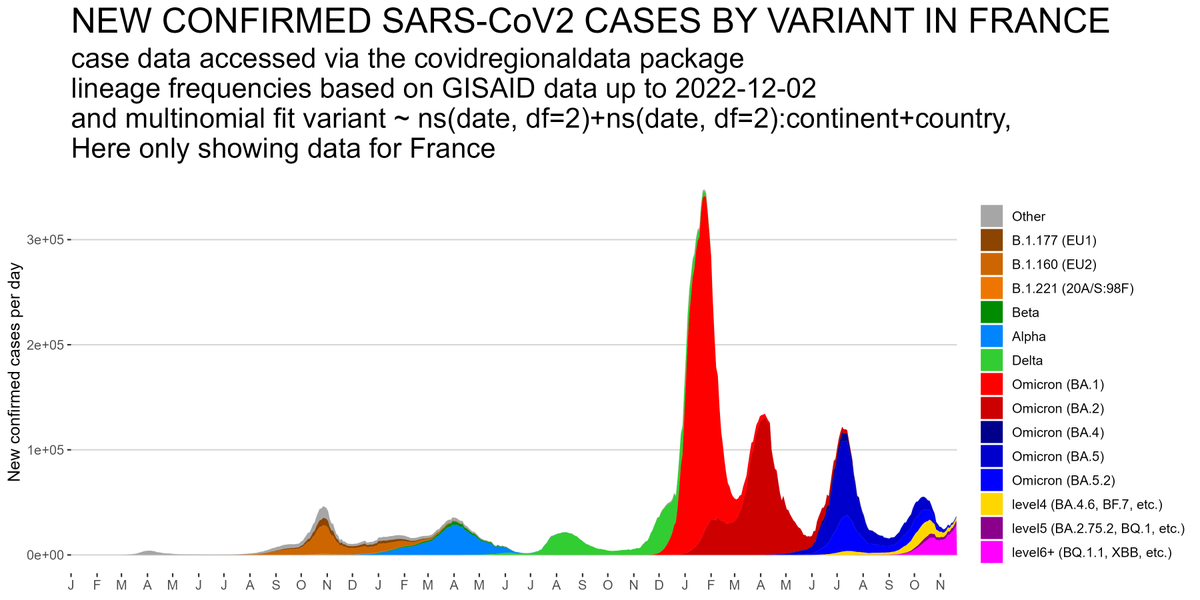
 When I say 10 I'm not counting 2 smaller waves in fact. So some might put it at 12. Two weeks ago this fit already detected a changepoint (ie growth in infections starting again).
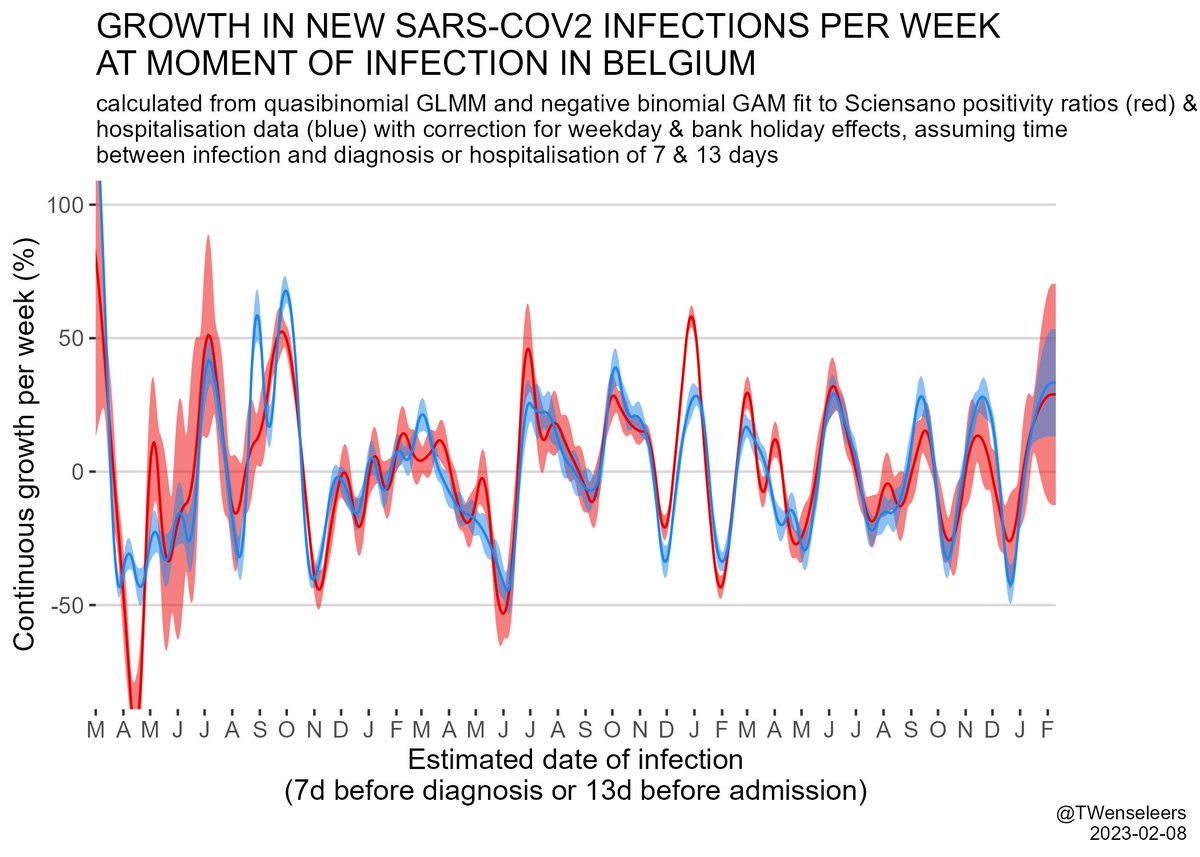
 Also in England XBB.1.9.1 is taking off fast...
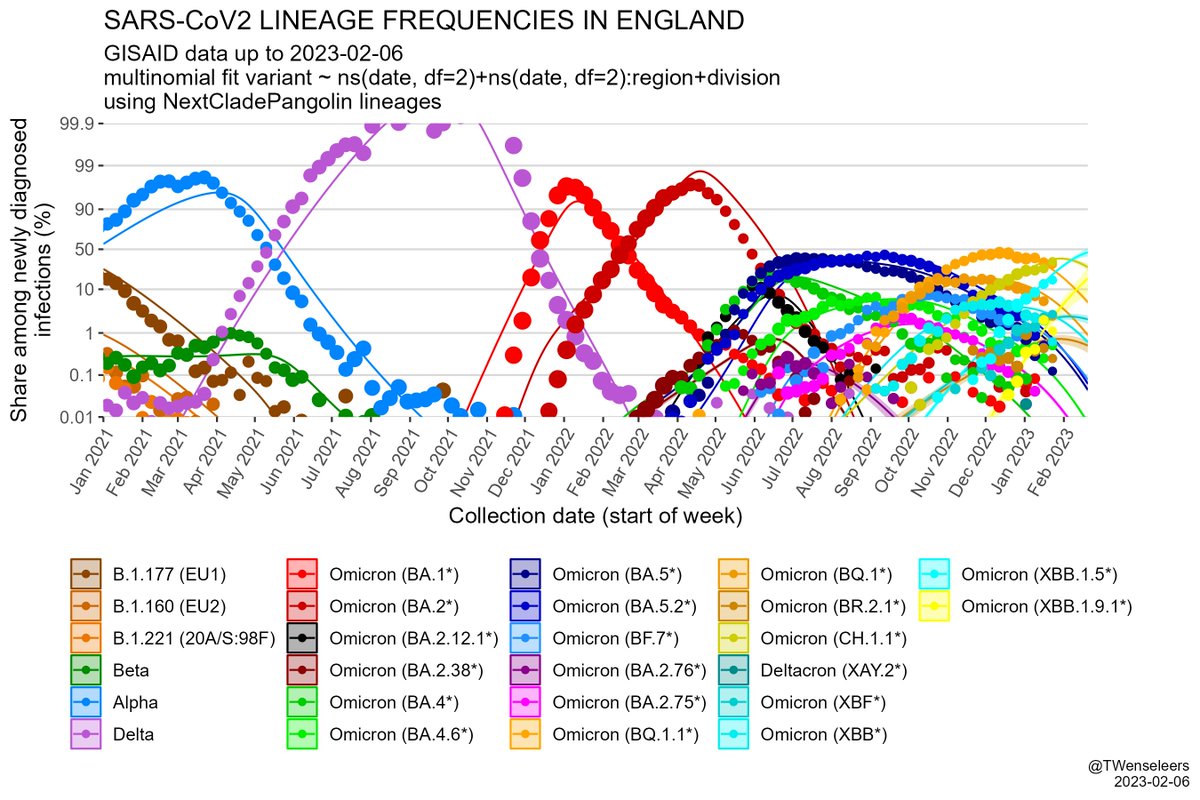
 Likewise, decline in Covid hospitalisations has also stopped again in the Netherlands & Germany...
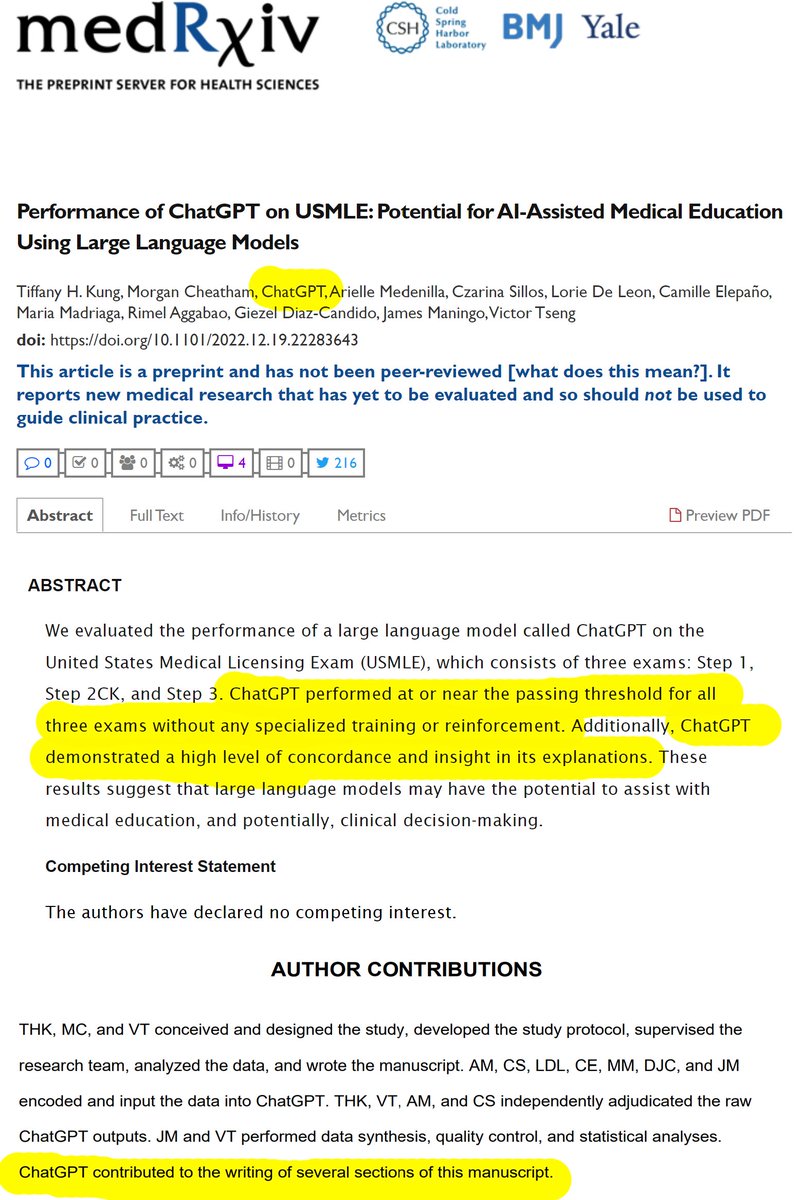 And now also a ChatGPT coauthored paper out on Pubmed... pubmed.ncbi.nlm.nih.gov/36549229/

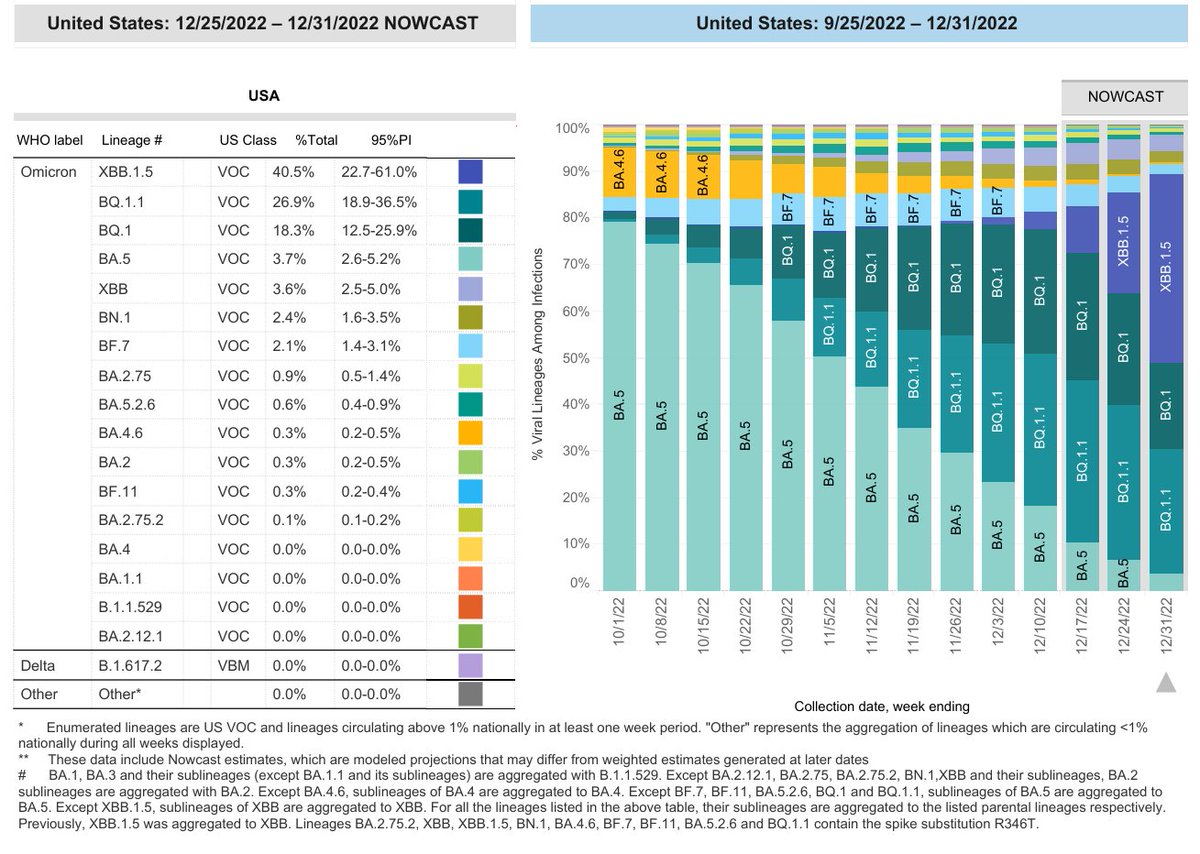
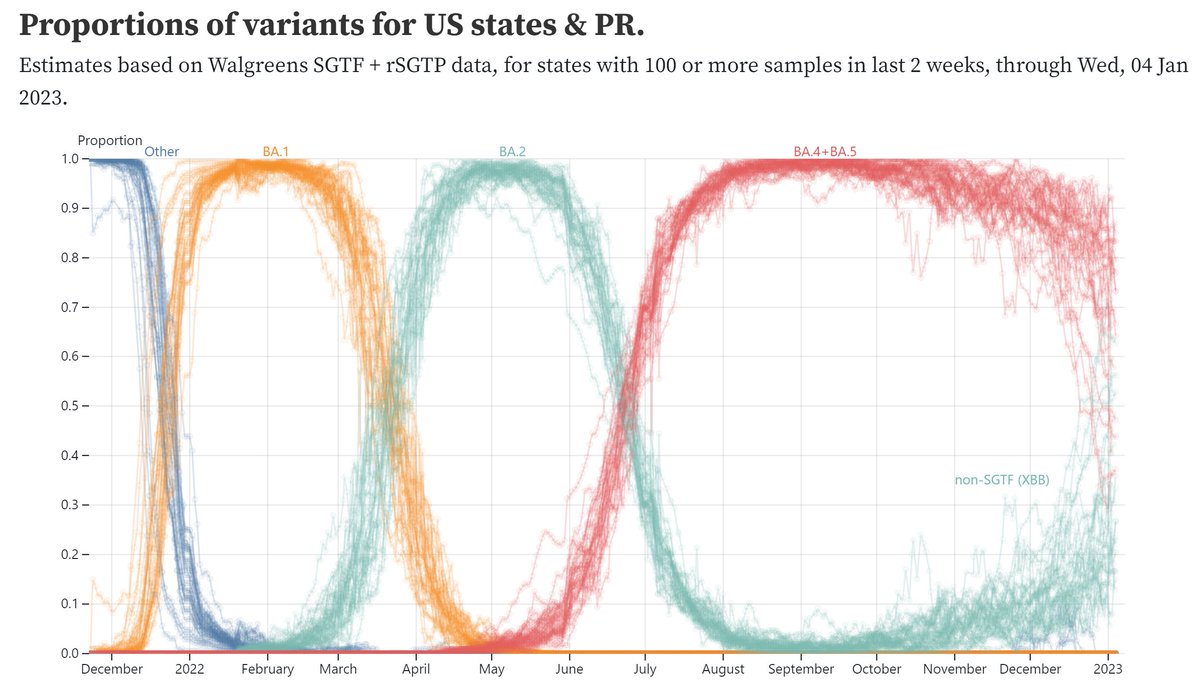
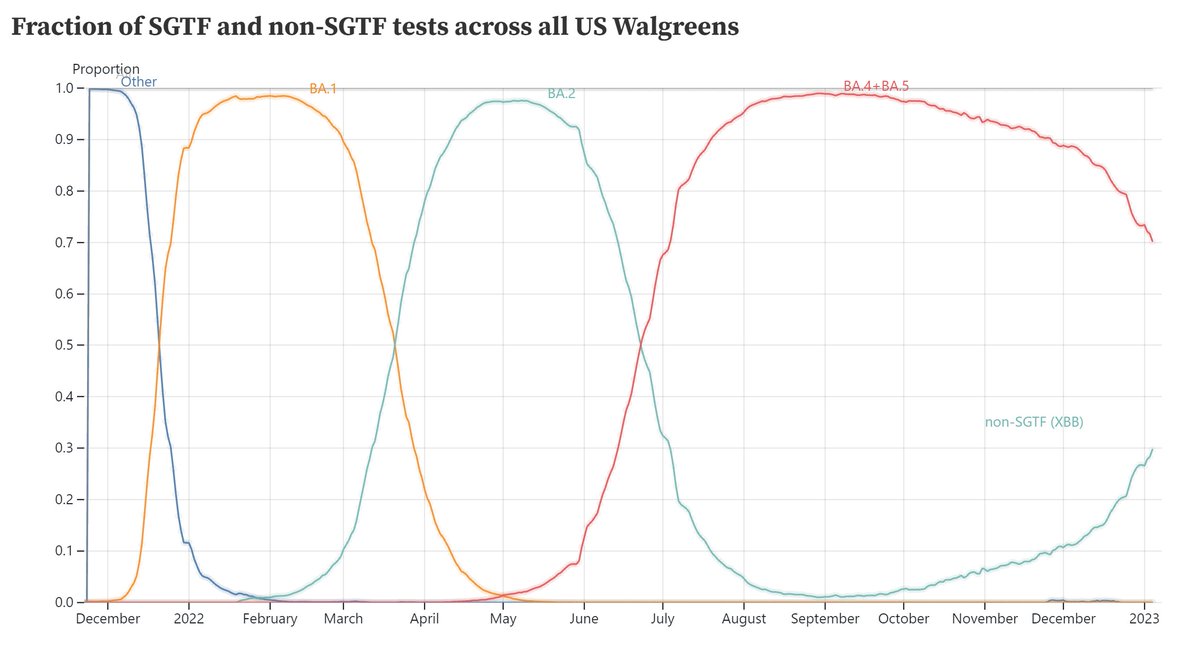
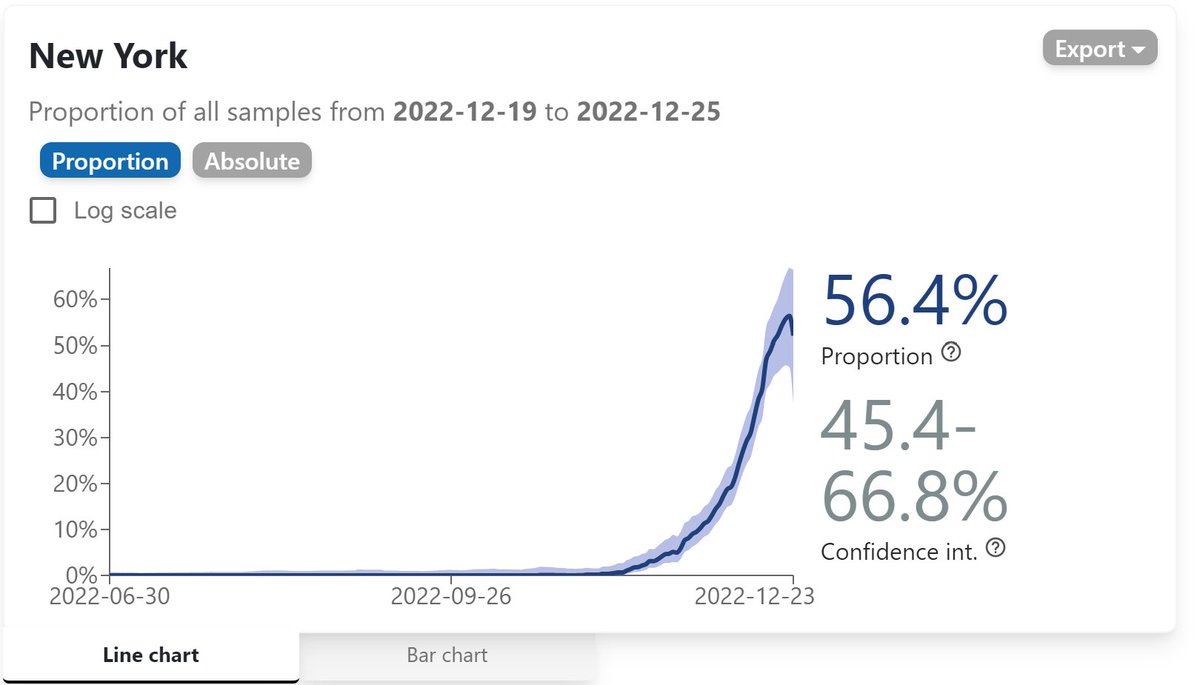
 The latest SGTF data show XBB.1.5 is at ca 30% the first week of Jan 2023, which is in fact in line with this week's CDC nowcast (but the SGTF data is much more accurate, as it's actual data, not a nowcast, and based on a much larger sample size). observablehq.com/@andy-bloch/wa…
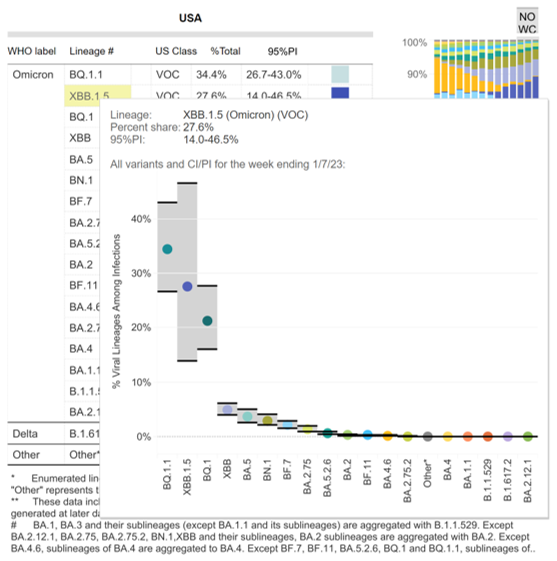
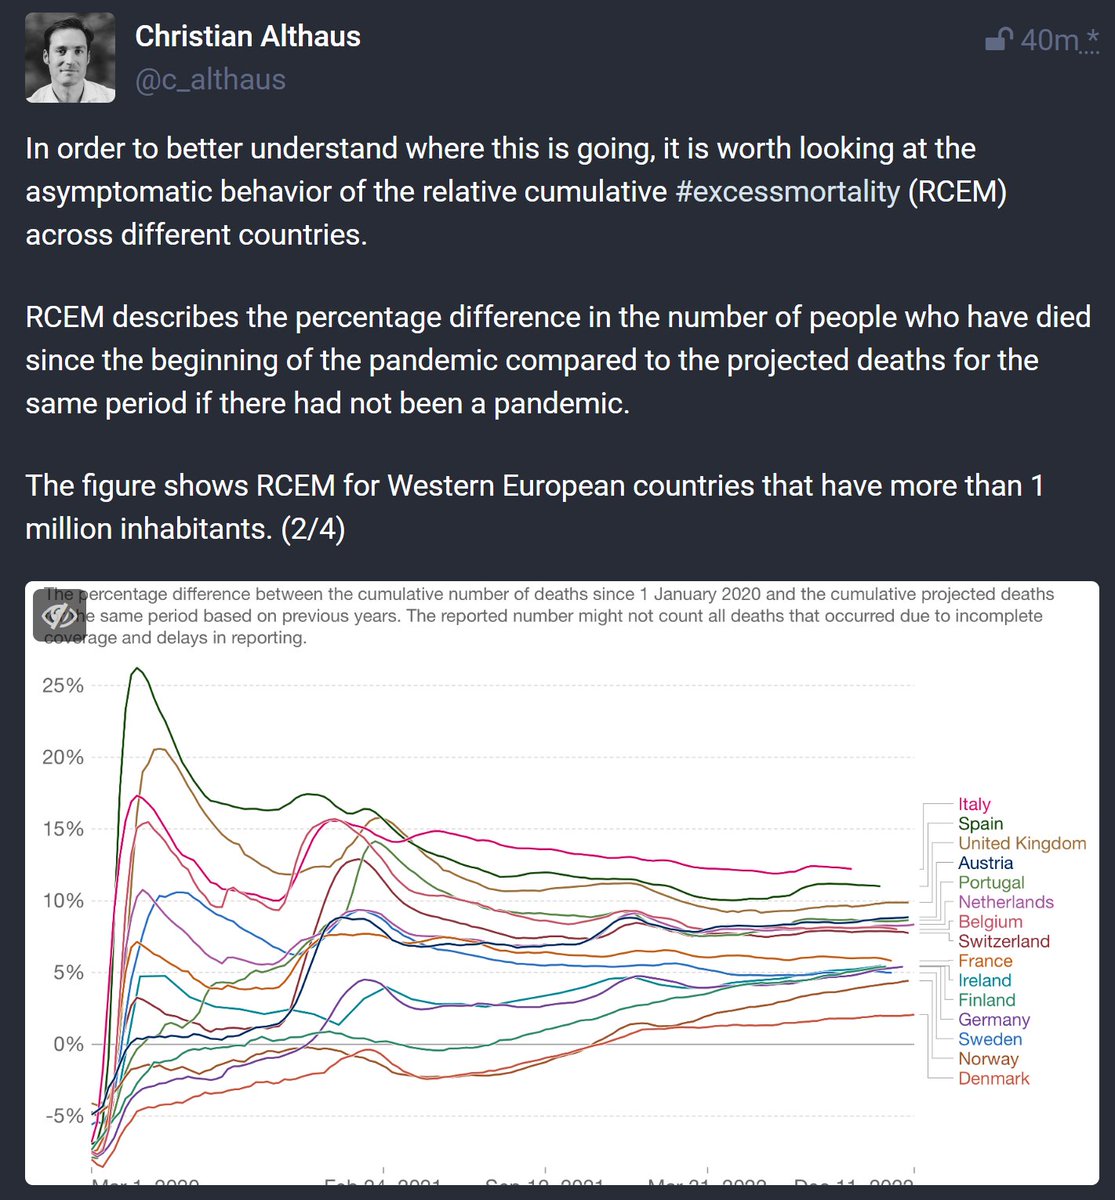 In Belgium baseline expected mortality (in absence of Covid) was now ca. 110K deaths/y. Covid being projecting to add ca. 5 500-11 000 deaths/year is a tad high I think - but possible that death toll of ca 5K Covid deaths we had this year will not massively improve in the future.


 Hospitalisation figures have also been on the rise again in France for a little while now.
 Toen hij gebouwd werd was zo wat iedereen er tegen. In de jaren '70 werd hij door KBC ei zo na gesloopt & het art deco interieur gestript. Als men hem als erfgoed had willen beschermen had men dat duidelijk toen moeten doen. gva.be/cnt/dmf2022112…
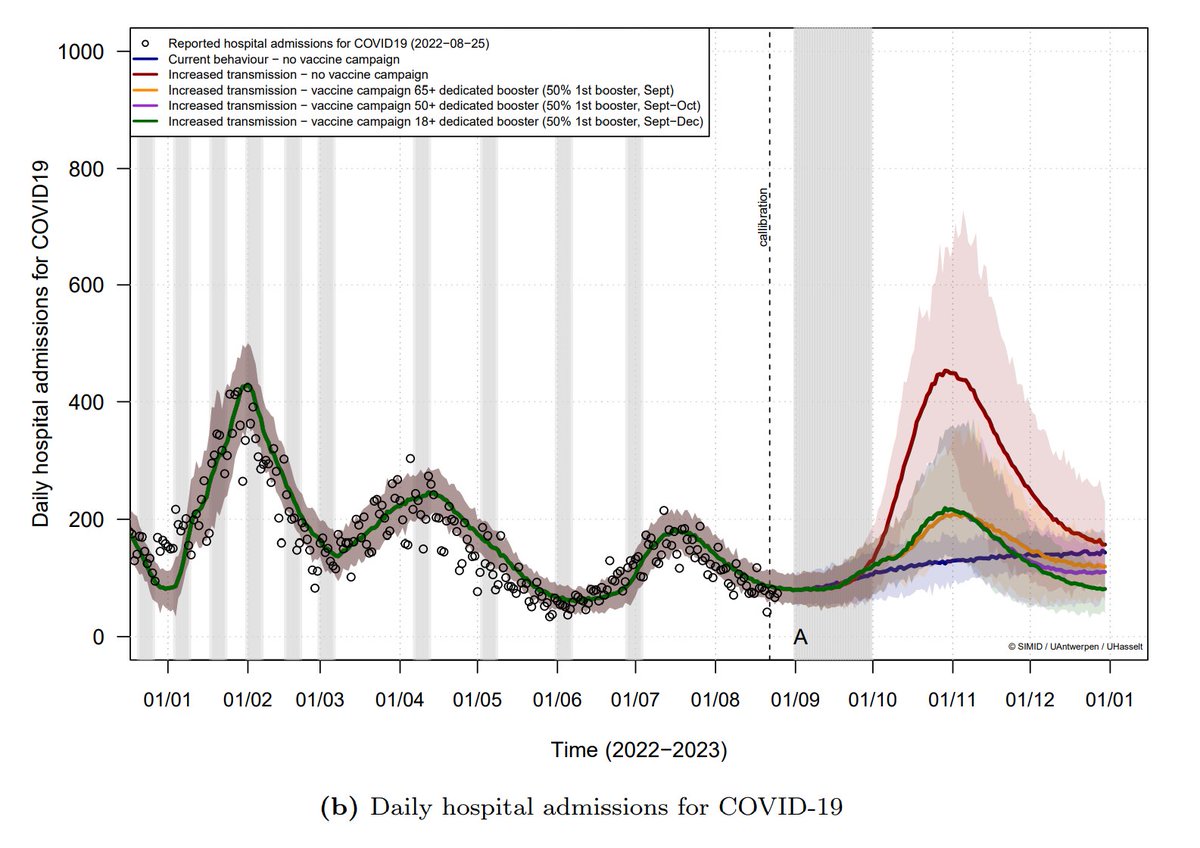
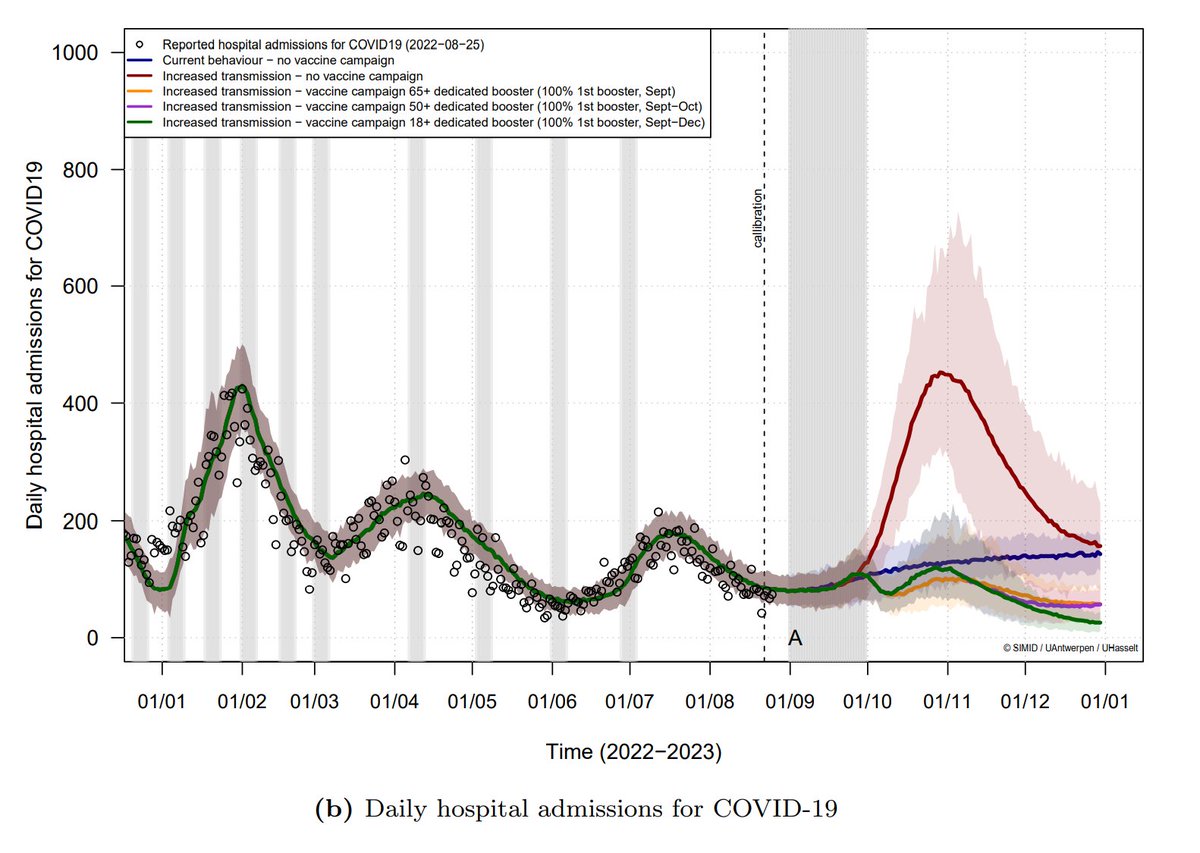 Eigenlijke data: golf iets kleiner dan de vorige. Wat is het probleem eigenlijk? Dat België een succesvolle vaccinatiecampagne heeft opgezet die heel wat hospitalisaties & sterfte heeft kunnen voorkomen?
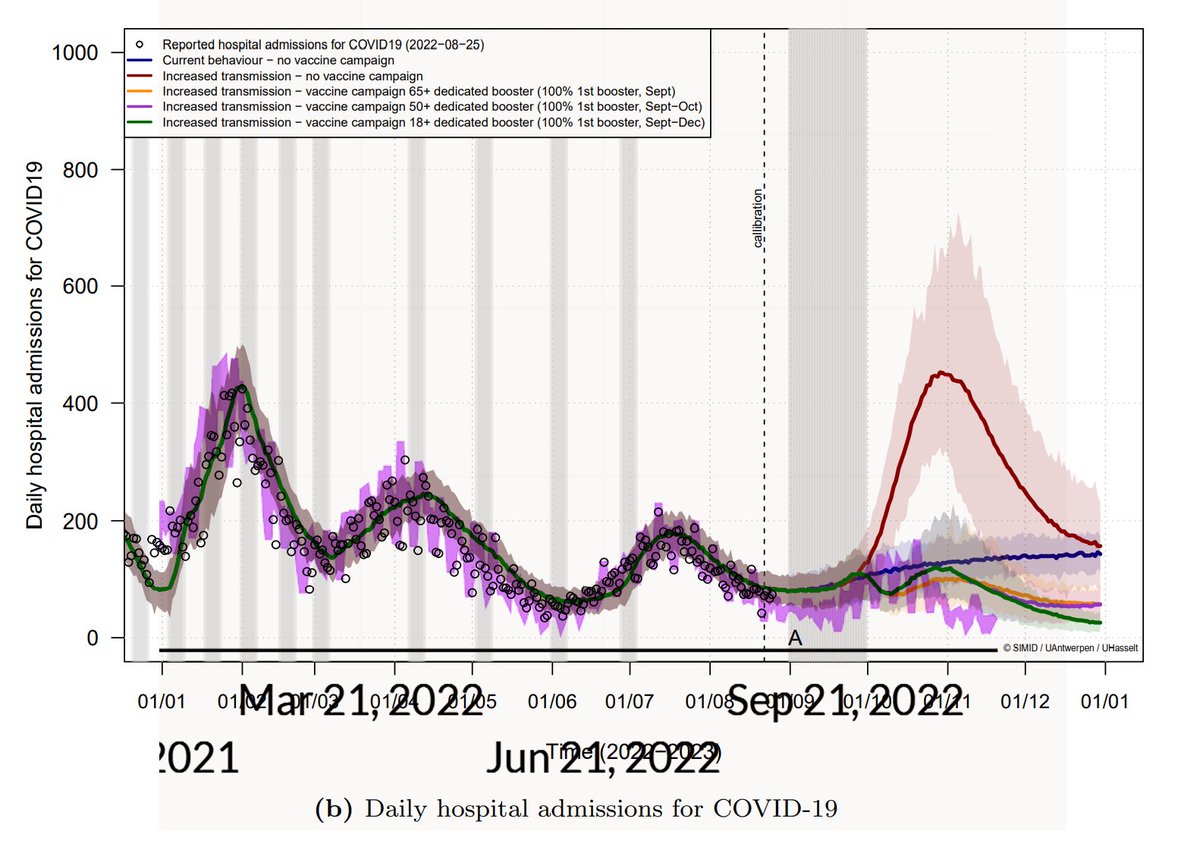
 Same pattern for confirmed Covid deaths: over the long term an exponential decline.
