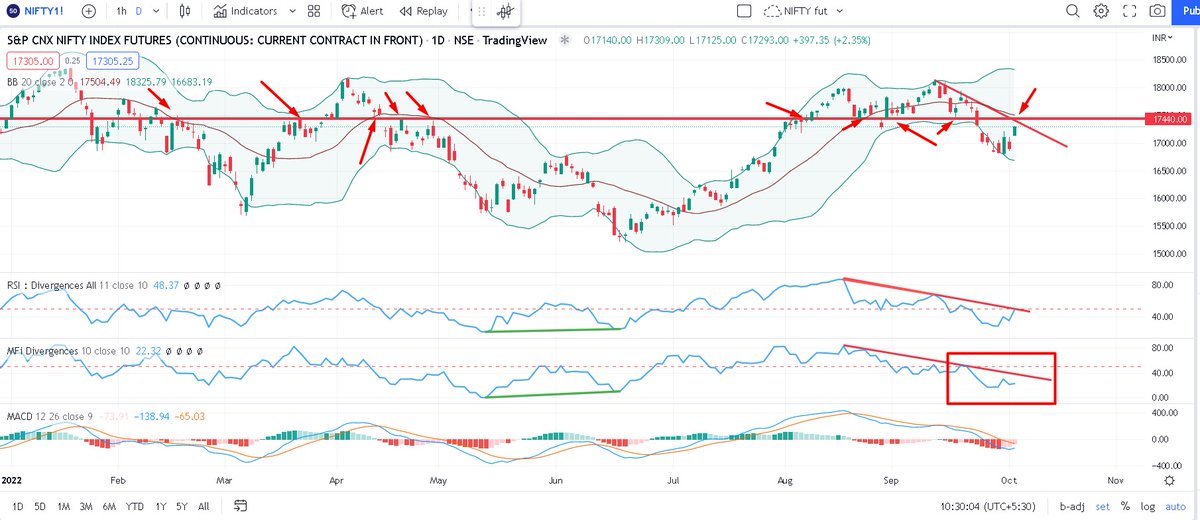
Not a clean bull case YET. I would be careful around this region. This weekly expiry might belong to bulls, but positionally a strong hurdle ahead
BTW, on candlesticks we had a BULLISH KICKER PATTERN. Rare and difficult to trade. But guranteed you won't get a boring market for next few days. Read 👇
This setup was shared on #Sentient on 23rd morning as a positional target for BNF
And this for Nifty fut. The chart/setup is self explanatory and I have openly explained this on twitter hundreds of times. This indicator combination is my bread & butter template
And this was the simple one line guideline. How one traded, what volume, how long one could keep the trade depends upon a trader's discipline and risk taking ability. That's why, when any of my students thank me, I say that 95% is his credit and 5% is mine :)
This is actually an interesting question and a correct observation. Many people before you also have made this observation, so I am going to explain this the best I can
I am trading since badla days. There being long meant you had to pay badla / interest and being short meant you received badla. Similar to an options buyer having theta burn and an options seller being theta positive. So the bias among pros were being short bit
Now, as of now I am an options buyer. All my strategies are geared towards options buying, so I have a theta burn continuosly. I do use strategies to cover that a bit, but still the burn is there
For people commenting on that thread that " bola tha" or " you are wrong", kindly get a lesson in basic comprehension
This was a probable head fake which I have explained earlier. Longs playing the breakout/bounce are trapped now. 17440 and 40500 remains the critical breakdown points. Stops remain at 18100 and 41800
Showing a simple data analysis, mainly OI/COI analysis to show how I pick up direction from OI. This pic is of COI ( cumulative OI of 3 months added) of BNF. See that huge COI buildup yesterday. OI = net longs = net shorts at end of day. Question is, who is winning ?
At close today, prices are 1. below today"s vwap 2. below yesterday's vwap 3. below 1SD of vwap of yesterday 4. below 1SD of vwap of today
Disclaimer : running positions from lower levels. Whenever I post about ITC, please assume that I have positions
The COI buildup started from 26th August. I have drawn an anchored VWAP from that date, Once this AVWAP was crossed, this AVWAP providing support. As of now support at 319-20 range, stops to be below this and watch how far this goes