Subhadip Nandy Profile picture
AVWAP Navigator : https://t.co/Eah3P4CyoU Options Mastery : https://t.co/n6DRc5ktWK
57 subscribers
Sep 26, 2024 10 tweets 7 min read
Did not do one of those lengthy technical threads for a long time. So here we go :

Intraday straddle/strangle selling 101 : The basics

( for someone experienced , all these points are known. But facing these simple questions on Twitter, so tried to give a simple overview. If I am wrong in any point or have missed something, please point that out and I will rectify / add ) Intrinsic Value
Intrinsic value is the amount by which an option is in-the-money (ITM). It represents the real, tangible value of the option if it were exercised right now.

🔹For a call option, intrinsic value is calculated as:
Intrinsic Value=Current Stock Price−Strike Price
For example, if the stock price is Rs. 135 and the strike price is 100, the intrinsic value is 35

🔹For a put option, intrinsic value is:
Intrinsic Value=Strike Price−Current Stock Price
If the stock price is Rs.135 and the strike price is 150, the intrinsic value is 15

If an option is out-of-the-money (OTM), its intrinsic value is zero because exercising it would not be profitable
Jun 25, 2024 10 tweets 3 min read
Here is the link for tomorrow :

Will show Nifty and BankNifty charts, best if one sees on a laptop/computer screen to see the layout. Mobile apps seems to show only one chart. Change background to black to see the SL lines.

I will be off markets tomorrow, so cannot answer any queries in realtime.tradingview.com/chart/HpnI5PSs/ Options Analyser analyses the whole option chain and shows Bullish or Bearish. Deep blue bars hitting > 96 is strongly bullish. Deep red bars <-96 are strongly bearish.
Value above 68 bullish , below -68 bearish.

Values between -68 and 68 are neutral/congestion .
Mar 16, 2024 8 tweets 3 min read
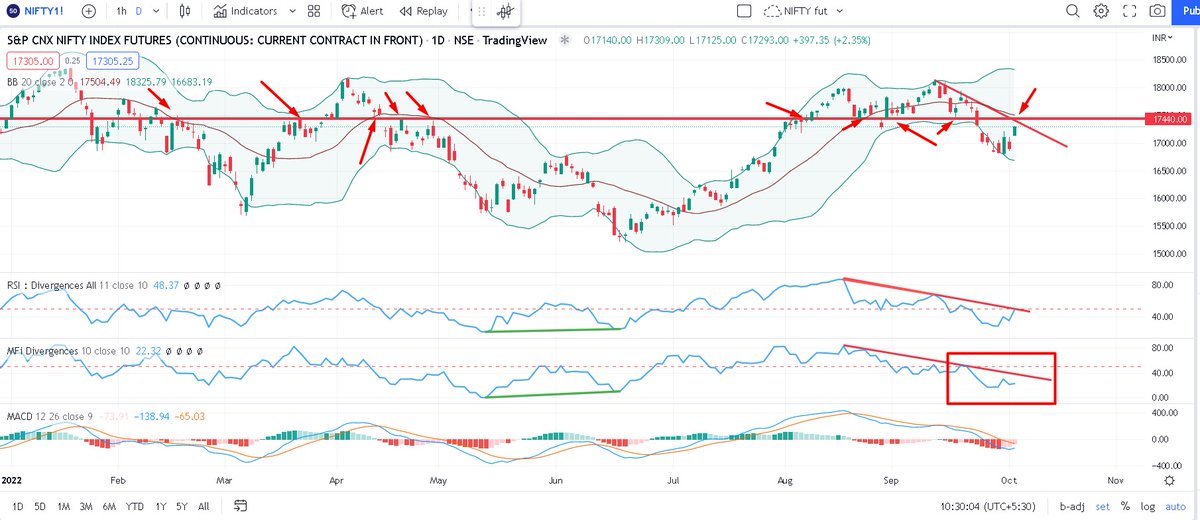
Positional analysis on Nifty. These are just pointers from charts and indicators which should be kept in mind for the rest of this March expiry Negative divergence on RSI and MFI
Volatility divergence on Bollinger Bands
MACD is sell signal, raw MACD line sloping down Image
Mar 14, 2024 4 tweets 4 min read
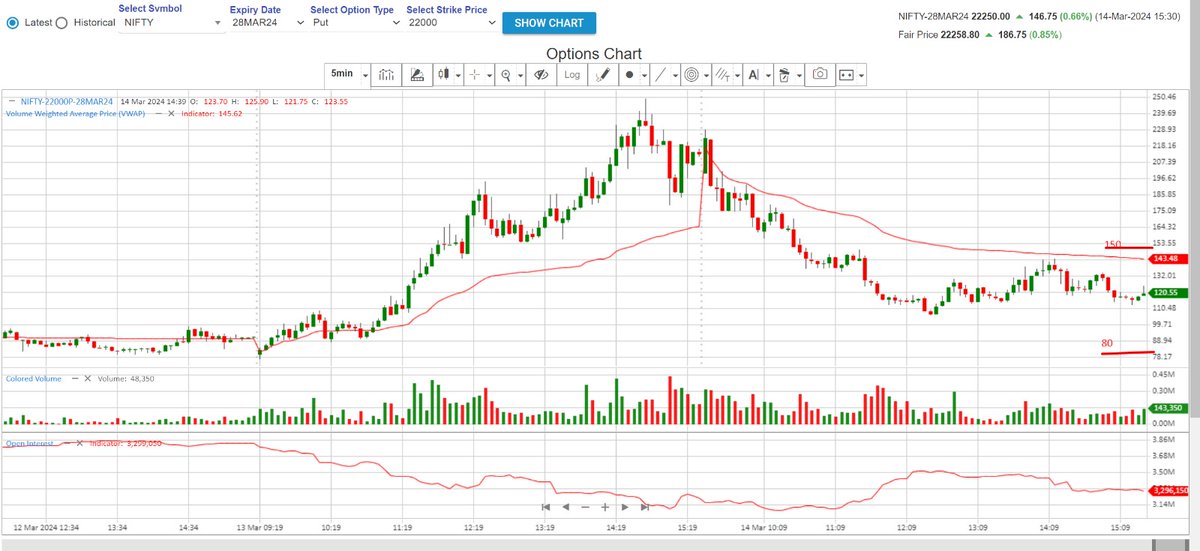
Nifty puts added OI from 22000-22000 which is normal as Nifty went up, so is the cut in the 22k ce OI.
What is abnormal is the cut in 22500pe, that should have added OI by the same logic.
So we now watch two strikes :
Nifty bullish if 22500pe trades below 310 and 22000pe trades below 80.

Nifty bearish if 22500pe trades above 392 and 22000pe trades above 150Image
Image
Image
Image
On BNF , two strikes stand out. The addition on the 47k ce ( thrice that of 47k pe) and addition in ITM 46500ce.

So we will watch these two strikes
BN bullish if the 46500ce trades above 1175 and 47000ce trades above 870
BN bearish if 46500ce trades below 850 and 47000ce trades below 580.

What's very interesting is the OI behavior on the 46500ce , the sellers kept on selling even when BN went up without any fear.

Makes me say they know something which makes BN much more bearish than NIFTYImage
Image
Image
Image
Oct 4, 2023 6 tweets 2 min read
BankNifty had an almost 28% increase in COI today. This COI increase in a large range day ( up or down) would have been justifiable, not in a range day like today. The only logic can be the coming RBI MPC meet from which someone is expecting something very very big Image So I went back for the last couple of years and tried to check how BN behaves after such and increase in COI
Image
Image
Jan 23, 2023 5 tweets 1 min read
Thanks to everyone who enquired about my well being. For the last almost 2 months, suffering from probable long covid symptoms.

1. I am a type 2 diabetic. Sugar etc was always under control. Now sugars, cholesterol etc have all shot thru the roof. HBA1C at 9 , ACR is 130 2. Joint pains at shoulder , xray-usg-mri does not find any physical reasons

3. Huge fatigue. Getting out of bed or going out is a chore.
Oct 24, 2022 5 tweets 2 min read
Why am I saying this, the explanation 🧵 First, some basic statistics :

en.wikipedia.org/wiki/68%E2%80%…
Oct 21, 2022 7 tweets 2 min read
One question which I often get asked is what is the minimum capital one requires to trade options .

Here is my take on this topic : A 🧵 The least notional value contract as of now is a lot of Nifty.
50*18000 = 9 lacs approx

investopedia.com/terms/n/notion…
Oct 14, 2022 5 tweets 2 min read
One trade so far on #sentient . waited out the morning as no signals, bought the reversal after the selloff as per setup, out now This was the trade as per setup. Logic explained, booked partial as per money mgmt rules, targeting explained
Oct 5, 2022 4 tweets 2 min read
Not a clean bull case YET. I would be careful around this region. This weekly expiry might belong to bulls, but positionally a strong hurdle ahead BTW, on candlesticks we had a BULLISH KICKER PATTERN. Rare and difficult to trade. But guranteed you won't get a boring market for next few days. Read 👇

therobusttrader.com/bullish-kicker…
Sep 26, 2022 4 tweets 2 min read
This setup was shared on #Sentient on 23rd morning as a positional target for BNF ImageImage And this for Nifty fut. The chart/setup is self explanatory and I have openly explained this on twitter hundreds of times. This indicator combination is my bread & butter template Image
Sep 23, 2022 10 tweets 2 min read
This is actually an interesting question and a correct observation. Many people before you also have made this observation, so I am going to explain this the best I can I am trading since badla days. There being long meant you had to pay badla / interest and being short meant you received badla. Similar to an options buyer having theta burn and an options seller being theta positive. So the bias among pros were being short bit
Sep 22, 2022 4 tweets 2 min read
Current update of these 55 min charts. Scenario looks precarious For people commenting on that thread that " bola tha" or " you are wrong", kindly get a lesson in basic comprehension
Sep 6, 2022 9 tweets 3 min read
Image Showing a simple data analysis, mainly OI/COI analysis to show how I pick up direction from OI. This pic is of COI ( cumulative OI of 3 months added) of BNF. See that huge COI buildup yesterday. OI = net longs = net shorts at end of day. Question is, who is winning ? Image
Sep 5, 2022 4 tweets 1 min read
What's up ITC ? Disclaimer : running positions from lower levels. Whenever I post about ITC, please assume that I have positions
Jun 17, 2022 6 tweets 2 min read
Good question. Let me explain this with the data I was watching. Will explain the current scenario too.

First read this :
investopedia.com/terms/a/a-d-ra…. This is the NSE total AD line. See the move from march 2020 and the exhaustion from dec 21
Jun 17, 2022 4 tweets 1 min read
The sharp dip/selloff in March 2020 was followed by an equally sharp bounce-back and a bull market. Traders who have not seen a true bear market think that that's how markets operate.
Problem is that bounce-back was financed by money printing by all the central banks of the world This bias I am seeing in a lot of tweets where people are jumping over each other in providing lists on what to buy. Everyone thinks that by being the first to suggest buys, they would be lauded as heroes when the market finally goes up ( it always ultimately goes up, right?)
May 27, 2022 4 tweets 2 min read
May 21, 2022 8 tweets 3 min read
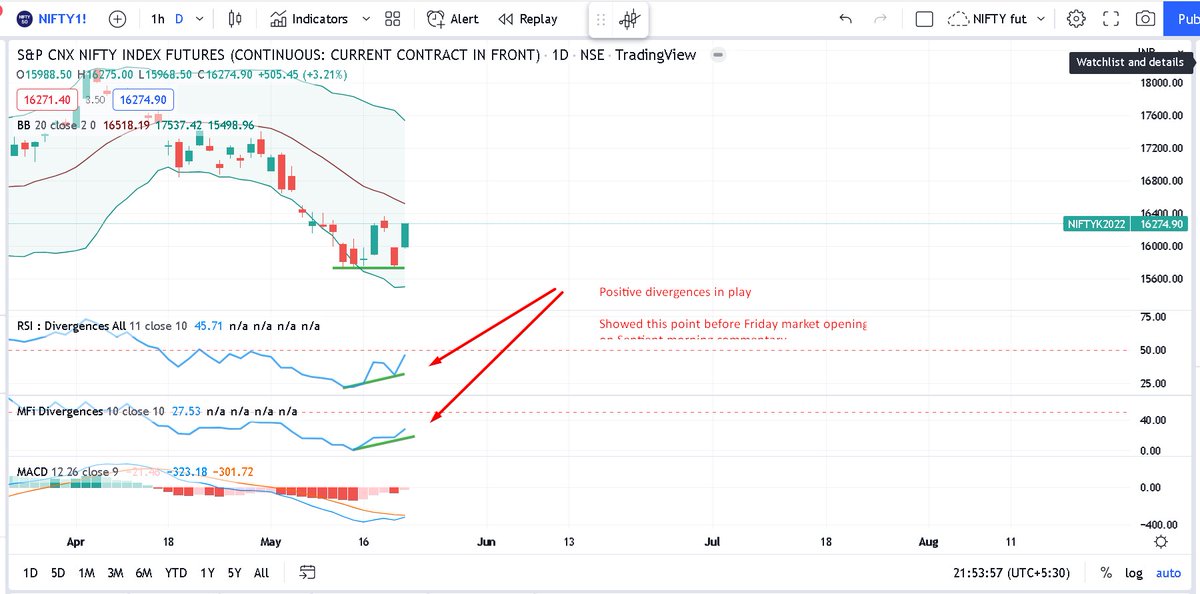
Jokes apart, let's see what the charts say. I normally do not open systems on a Saturday, but this friday move, SGX dance and finally the fuel excise cut made me curious. Do read with a pinch of salt as my decision might be clouded by the fact that I am carrying longs 😎 Positive divergences on RSI and MFI
May 20, 2022 6 tweets 1 min read
In early 2000s, we traded a stock called Ramco Systems. The stock was purely operator driven with regular buying and selling freezes. Such volatility attracted us daytraders like moths to a fire. The bullish ones amongst us as well as the bearish ones, all lost money whatever we did. It was that kind of absurd moves, this was one operator whom we absolutely failed to decipher. So someone amongst us came up with a theory .
May 18, 2022 4 tweets 1 min read
Hey cryptobros, see 29k on Bitcoin ? see it well, jee bharke dekh lo :)

This time I am actually shorting bitcoin. The time for "tawk" is over. Action now ! Image Short from 29628, trailig SL now at 29422 Image