CRAFT A DATA STORY when you need someone to understand something in a new way & take action. I’ll guide you through the process in workshops in London Oct 26 & virtually Nov 17th (storytellingwithdata.com/workshops). In the meantime, here are 10 tips for effective data stories. 

1. Recognize the difference between exploring data & using data to explain something to another human. When doing the latter, consider your audience, what they care about, and how to best communicate to them.

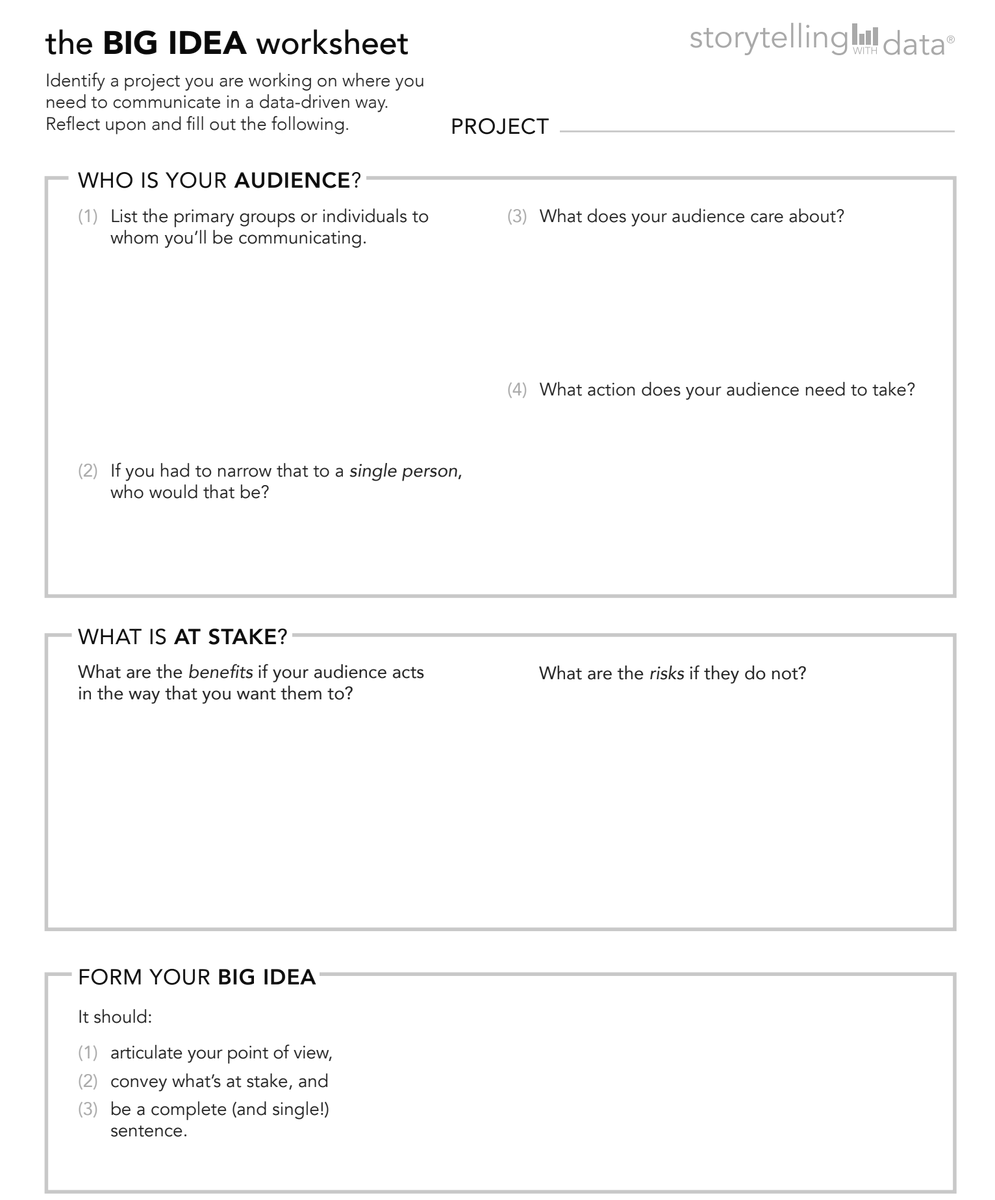
2. Before you make graphs & slides, start low tech—plan with pen & paper. Complete the Big Idea worksheet to prioritize your audience & get clear on your overarching message. Download worksheet: storytellingwithyou.com/bigidea

3. Brainstorm content that will help you communicate your message. Edit ruthlessly. Arrange your ideas into a storyboard, then vet & refine. Only AFTER you’ve done this, should you turn to your tools.

4. Making a graph in your tool is the first step in #dataviz—not the last. Move beyond tool defaults to make a graph that works for you, your data, & your audience.

5. Choosing an effective graph often means iterating through different views. With your key takeaway in mind, assess which view works best for communicating it to your audience.
6. Declutter your graphs & slides, eliminating the non-essential.

7. Focus attention sparingly—either limit what you show or use visual contrast to direct people’s eyes to where you want them to look in your graphs & slides.

8. Title each slide with the key takeaway (don’t make your audience guess!)—this ensures your audience doesn’t miss it & primes them for the details.

9. Use story to connect the pieces, making it clear how each graph, slide, and topic relates to the next. Identify the tension & the audience action that will resolve it.
10. It takes TIME and PRACTICE to tell engaging & informative data stories. Leave yourself time for this part of the process—it’s this critical point where all your effort fails or succeeds! Join an upcoming workshop for more guidance & resources: storytellingwithdata.com/workshops


• • •
Missing some Tweet in this thread? You can try to
force a refresh