Let us look at the European gas market.
Why has TTF collapsed? Is Europe out of the woods? What matters for commodity price formations? What will matter in 2023...?
1/n
Why has TTF collapsed? Is Europe out of the woods? What matters for commodity price formations? What will matter in 2023...?
1/n

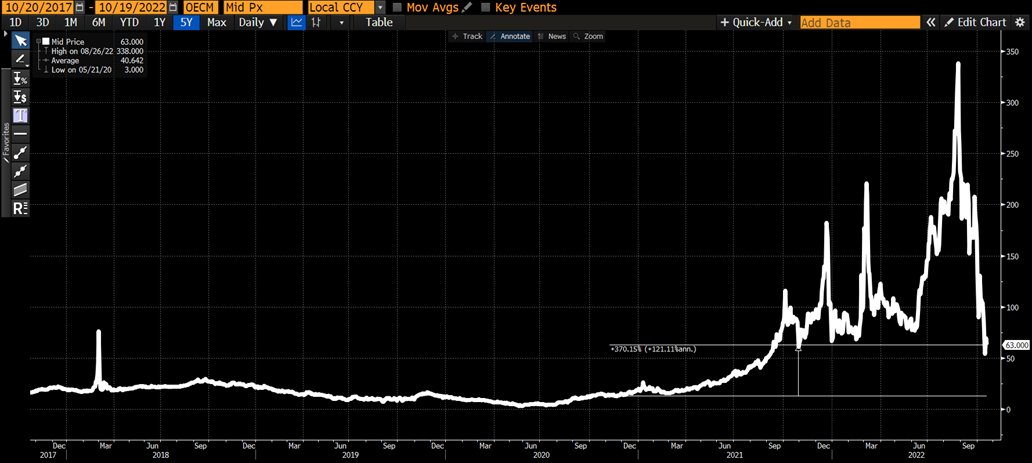
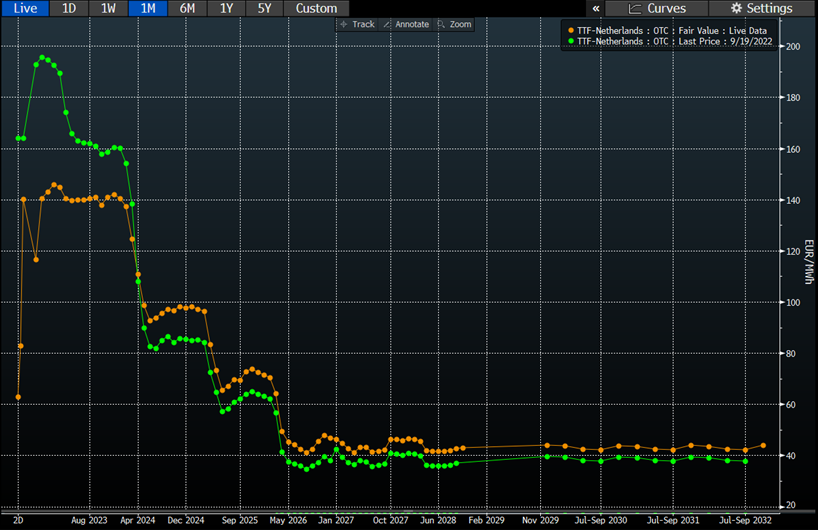
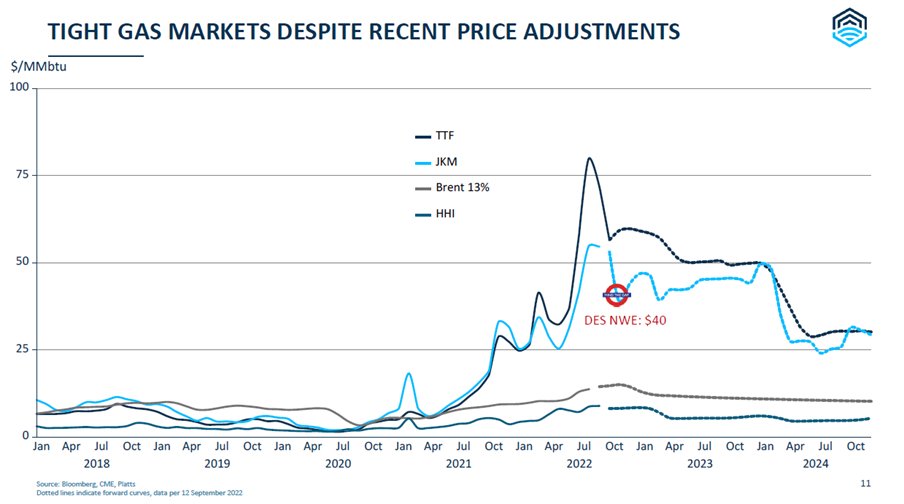
European gas prices - both TTF & NBP - have collapsed right into the start of the winter season, down from its peak of €338/MWh post Nord Stream 1 sabotage news to now €63/MWh.
Mind you though, TTF was €13/MWh 2 years prior - up still 370%.
2/n
Mind you though, TTF was €13/MWh 2 years prior - up still 370%.
2/n
Why is TTF lower?
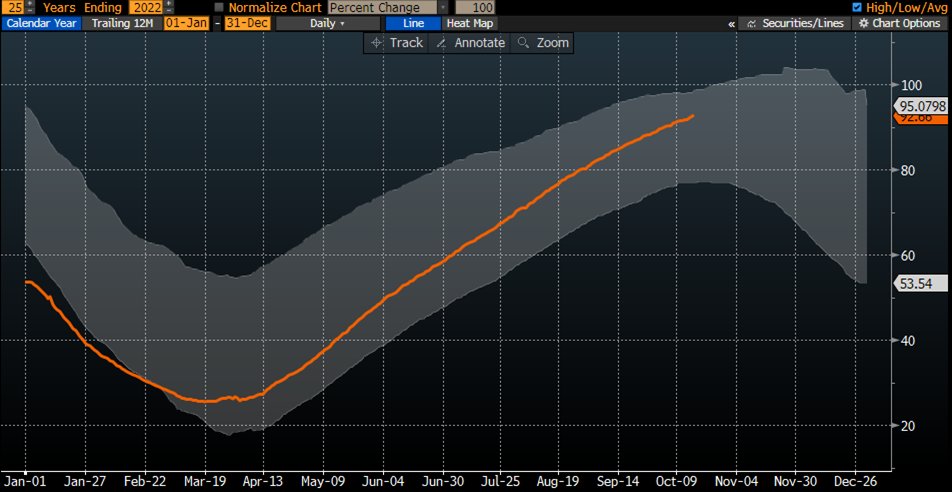
Because natgas can only be consumed or stored. If storage is (95%) full & not consumed (mild weather), prices have to do the work to keep system balanced as comdties trade in present (d-s), unlike equities/bonds which discount future.
3/n EU storage in %
Because natgas can only be consumed or stored. If storage is (95%) full & not consumed (mild weather), prices have to do the work to keep system balanced as comdties trade in present (d-s), unlike equities/bonds which discount future.
3/n EU storage in %
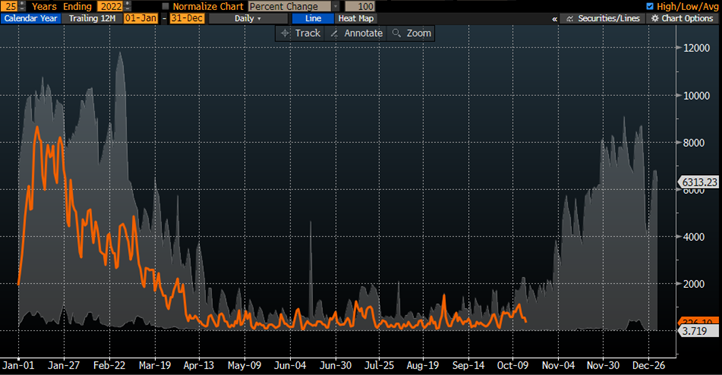
And Europe has not yet began to consume gas as it experiences and exceptionally mild October so far.
4/n EU gas withdrawal in (GWh/day)
4/n EU gas withdrawal in (GWh/day)
So is the gas crisis over? Of course not.
Europe needs to replace even more LNG in 2023 which will get much harder.
One way to verify that is by looking at the futures curve. It prices TTF at €140/MWh come Nov 2022 and into April 2024.
5/n
Europe needs to replace even more LNG in 2023 which will get much harder.
One way to verify that is by looking at the futures curve. It prices TTF at €140/MWh come Nov 2022 and into April 2024.
5/n
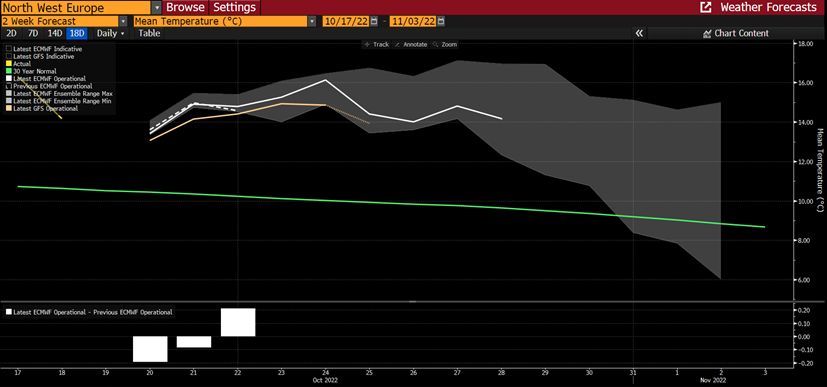
For now, let's be grateful EU operaters filled storages across Europe "comme il faut" by saving 13% YTD yoy & helped by the weather gods (summer heat wave; mild winter start).
6/n 14 day weather forecast vs 30y normal
6/n 14 day weather forecast vs 30y normal
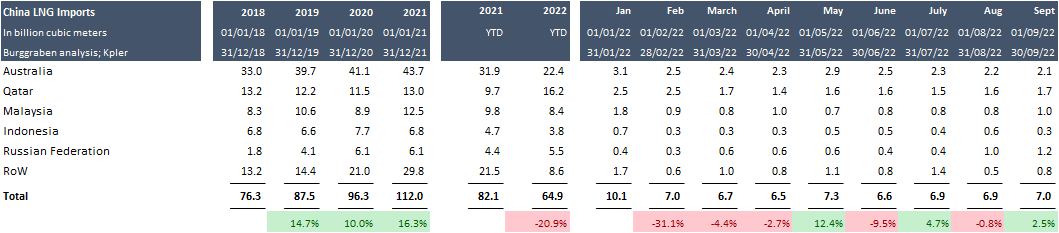
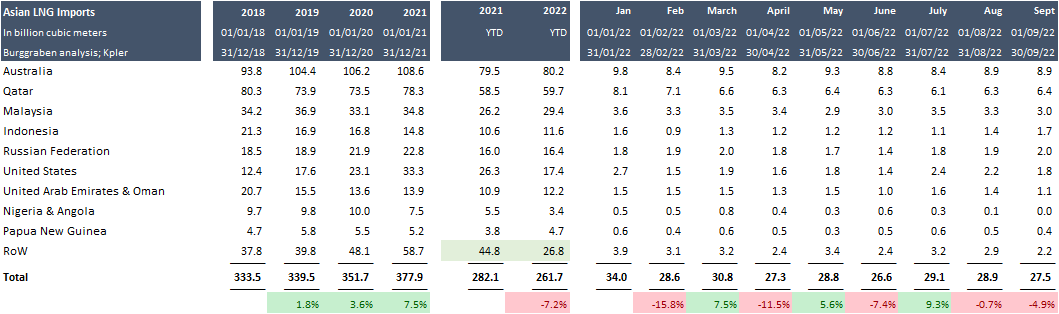
Not just EU savings and weather helped, China too!
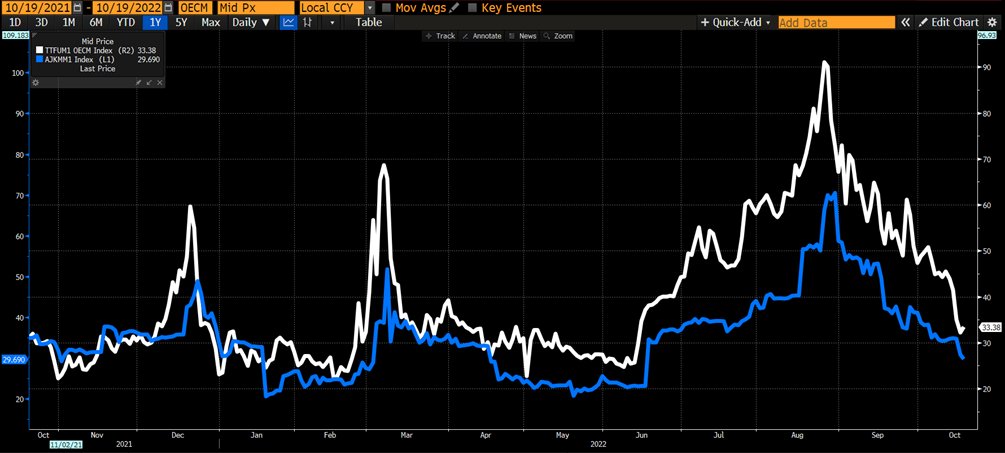
20% lower Chinese LNG purchasing yoy matters a lot too as it dragged Asian JKM prices lower into winter months as Asia obviously competes for those same LNG spot barrels with Europe (ex Australia; ex l-t Qatar contracts).
7/n
20% lower Chinese LNG purchasing yoy matters a lot too as it dragged Asian JKM prices lower into winter months as Asia obviously competes for those same LNG spot barrels with Europe (ex Australia; ex l-t Qatar contracts).
7/n
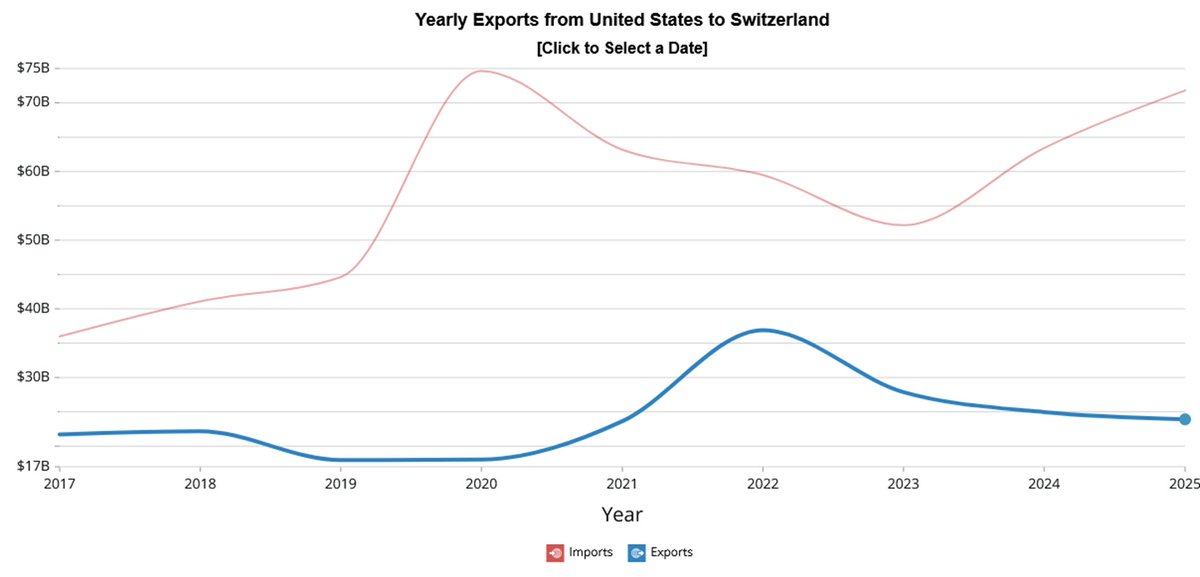
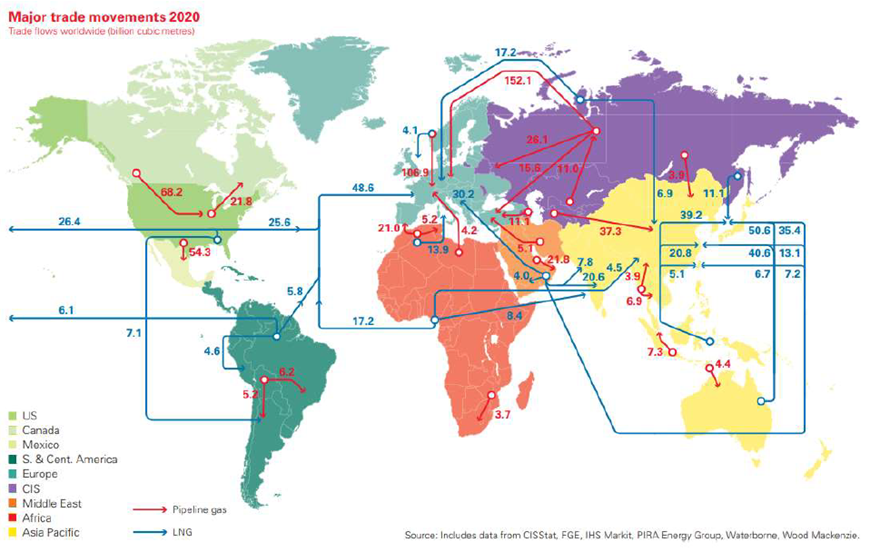
Here is a visual how to think about the global LNG market.
In general: US, Qatar & Australia are the big 3 exporters while EU, China, Japan & South Korea are the big importers of the global LNG market.
Of course, Middle East (UAE; Oman) & Nigeria or Angola matter too.
7/n
In general: US, Qatar & Australia are the big 3 exporters while EU, China, Japan & South Korea are the big importers of the global LNG market.
Of course, Middle East (UAE; Oman) & Nigeria or Angola matter too.
7/n
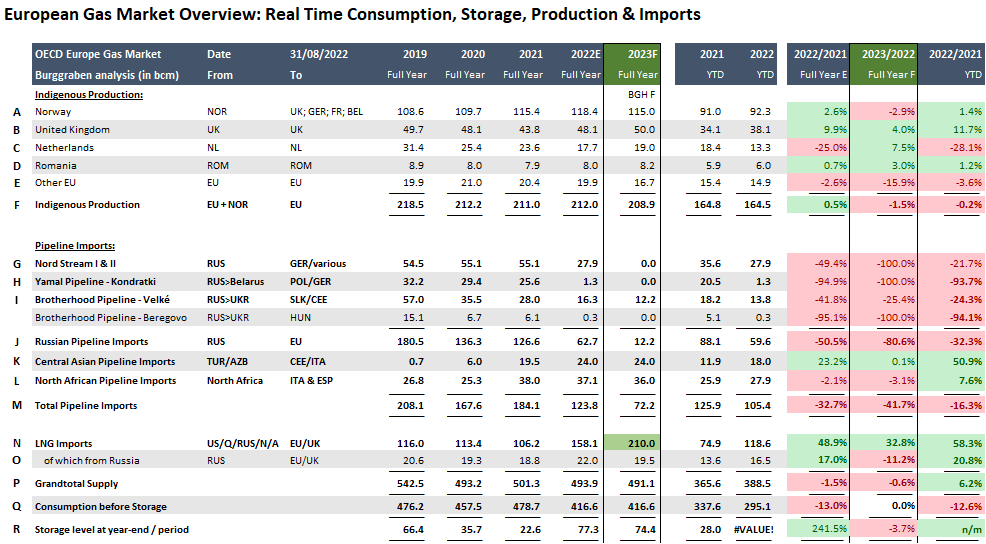
So how can Europe balance its 2023 market?
It will have to source approx 210bcm LNG, ceteris paribus.
That is 60bcm > than 2022 (which was 60bcm > than 2021).
Weather + Groningen field spare cap of 20bcm are only factors that can change this forecast meaningfully.
8/n
It will have to source approx 210bcm LNG, ceteris paribus.
That is 60bcm > than 2022 (which was 60bcm > than 2021).
Weather + Groningen field spare cap of 20bcm are only factors that can change this forecast meaningfully.
8/n
China freed-up 13-15bcm in 2022 for Europe to contract away in the LNG spot market.
If they will re-engage (which we suspect) & continue LNG growth path to replace some coal use, prices (not politicans god forbid!) will have to do the work - like now - to clear market!
9/n
If they will re-engage (which we suspect) & continue LNG growth path to replace some coal use, prices (not politicans god forbid!) will have to do the work - like now - to clear market!
9/n
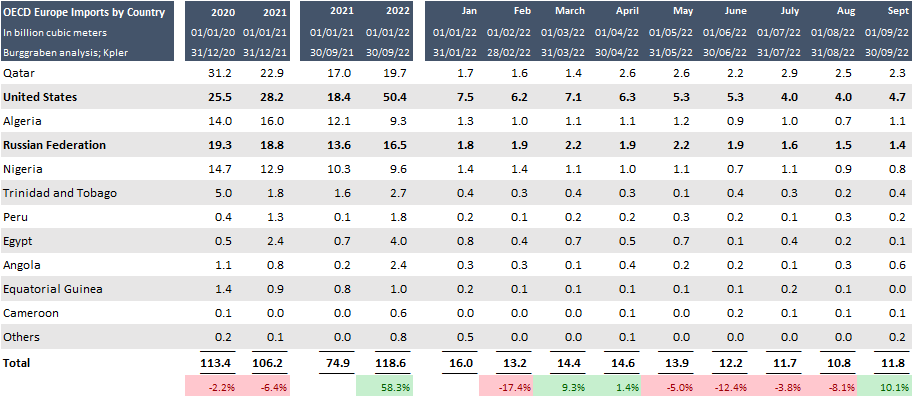
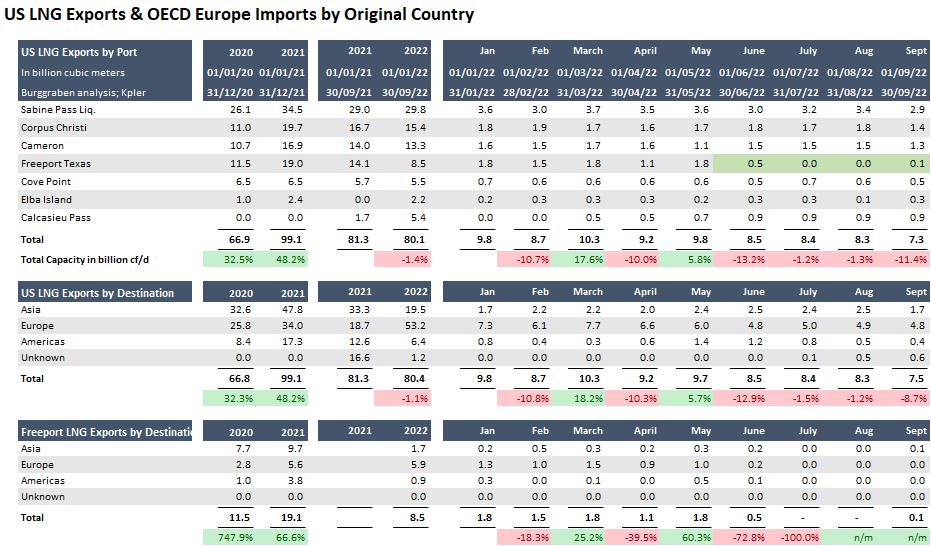
Europe was able to purchase 60% more LNG mainly from the US (75% incremental vol).
That is because US contracts have destination flexibility = means cargos owner were able to sell on the way to its original destination (say Japan) into Europe to make instant profit - nice!
10/
That is because US contracts have destination flexibility = means cargos owner were able to sell on the way to its original destination (say Japan) into Europe to make instant profit - nice!
10/
In 2021, US operators had total export capacity of 141bcm pa (13.7bcf/d) & ran it at capacity (never without risk).
US operators have incentive (lower HH prices; arbitrage) to increase such capacities. But infra expansion takes time. 2025/26 is the time for more exports.
11/n
US operators have incentive (lower HH prices; arbitrage) to increase such capacities. But infra expansion takes time. 2025/26 is the time for more exports.
11/n
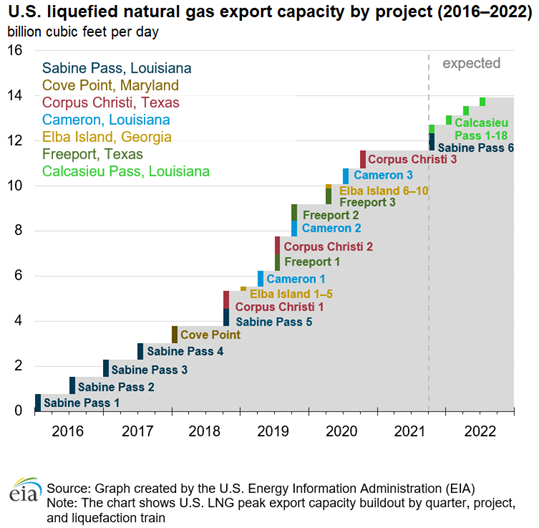
The return of the Freeport Terminal in Q4 2022 helps but will not move the dial.
It adds 6bcm incremental supply for Europe in 2023. We are looking for 60bcm!
12/n
It adds 6bcm incremental supply for Europe in 2023. We are looking for 60bcm!
12/n
So far in 2022, cargo owners had a huge incentive to re-sell LNG at spot to EU - if they could.
They usually purchased LNG pre-2020 on a long-term contract paid $6-10/MMBtu. Such LNG could be sold for >$30 all year, at times at $75 in spot market.
13/n
They usually purchased LNG pre-2020 on a long-term contract paid $6-10/MMBtu. Such LNG could be sold for >$30 all year, at times at $75 in spot market.
13/n
What matters however is that Qatar does not have break-up clauses or destination flexibility.
Re-directing Qatar cargos requires (Asian) buyers to return it to Qataries at par (<$10/MMBtu). Why would they?
14/n
ft.com/content/1e2046…
Re-directing Qatar cargos requires (Asian) buyers to return it to Qataries at par (<$10/MMBtu). Why would they?
14/n
ft.com/content/1e2046…
Let's enjoy the fact for now that natgas has to clear daily within its physical infrastruture which is storage constrained.
Real challenge however will be to pull enough LNG into Europe come 2023.
For that prices must do THE WORK.
15/n Thx
Real challenge however will be to pull enough LNG into Europe come 2023.
For that prices must do THE WORK.
15/n Thx
https://twitter.com/BurggrabenH/status/1581783290725351424?s=20&t=0eF7HbYPOeSA_BFTgIPXDw
• • •
Missing some Tweet in this thread? You can try to
force a refresh