The Most Unknown but Powerful Hacks Related to Tradingview:
#8 is Shocking to Everyone!
Thread 🧵🧵
(1/N)
#8 is Shocking to Everyone!
Thread 🧵🧵
(1/N)

#1 How to Get Tradingview Premium for Free?
Open an account with Zerodha or Fyers, and you will be able to use Tradingview Pro for Free.
Fyers by default, provides it.
In Kite Zerodha, one needs to change the settings.
(2/N)
Open an account with Zerodha or Fyers, and you will be able to use Tradingview Pro for Free.
Fyers by default, provides it.
In Kite Zerodha, one needs to change the settings.
(2/N)
#2 Hide Indicators!
If you don't want to someone to know the name of proprietary indicators, then you can hide them with one click!
(3/N)
If you don't want to someone to know the name of proprietary indicators, then you can hide them with one click!
(3/N)
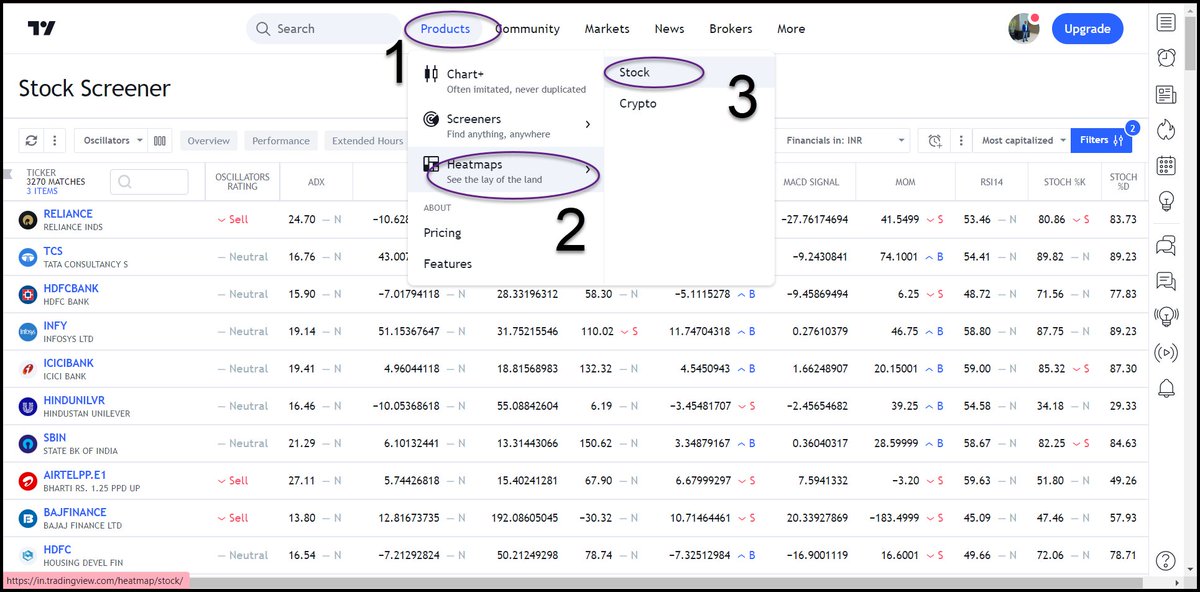
#3 Heat Map
Many software providers highlight 'Heat Map' as their premium feature.
But you can get it in Tradingview for free!
Homepage -> Products -> Heatmaps -> Stock
(4/N)
Many software providers highlight 'Heat Map' as their premium feature.
But you can get it in Tradingview for free!
Homepage -> Products -> Heatmaps -> Stock
(4/N)

#4 Proprietary Strategies
You can find many 'Proprietary strategies' for free!
Indicators -> Technicals -> Strategies
(5/N)
You can find many 'Proprietary strategies' for free!
Indicators -> Technicals -> Strategies
(5/N)

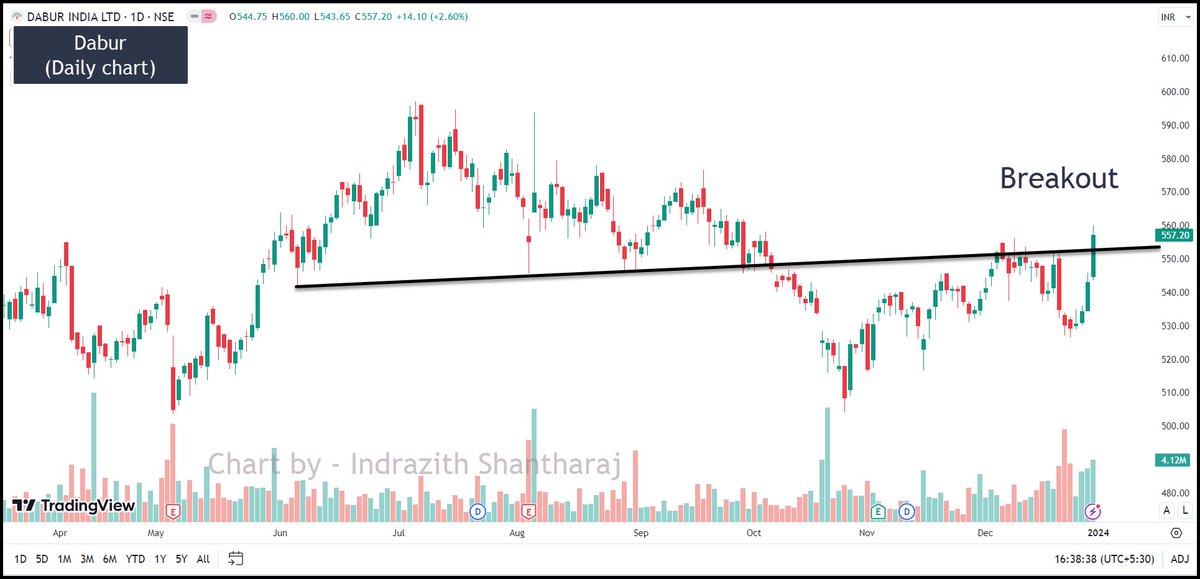
#5 Compare the Strength of a Stock With an Index
You can compare whether a stock is overperforming or underperforming compared to the index.
(6/N)
You can compare whether a stock is overperforming or underperforming compared to the index.
(6/N)
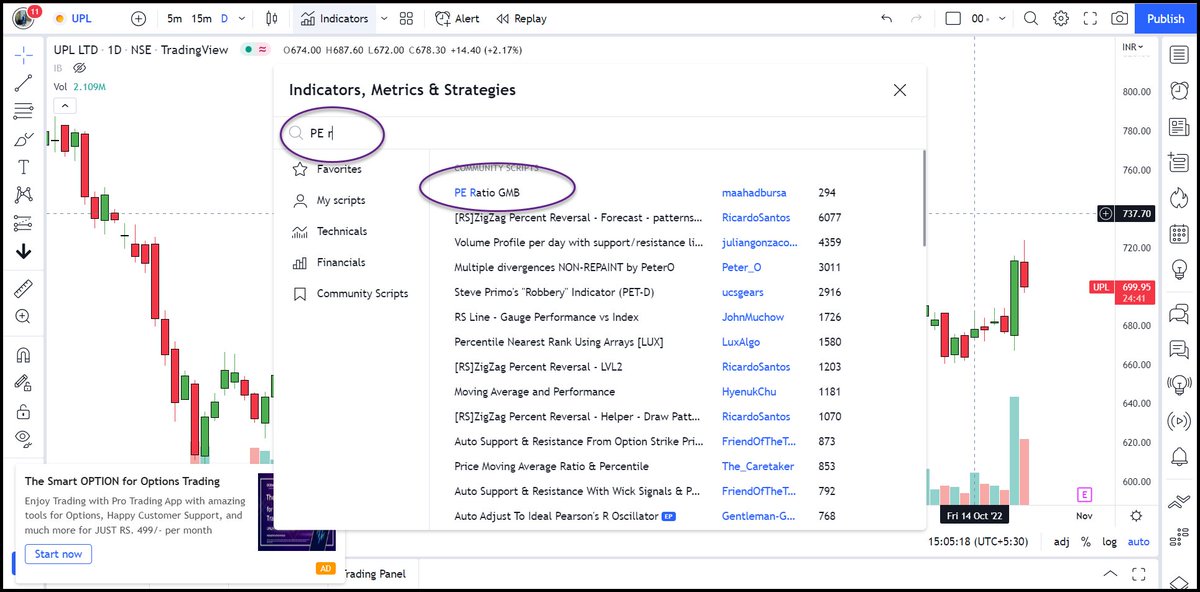
#6 Fundamental Data
Many people think it's not possible to get fundamental data in tradingview.
But we can get fundamental info, just type the fundamental parameter in the indicator section!
(7/N)
Many people think it's not possible to get fundamental data in tradingview.
But we can get fundamental info, just type the fundamental parameter in the indicator section!
(7/N)
#7 Revolution Volatility Bands
Are you an options seller who looks for range-bound moves to sell both CE &PE?
Use the 'Revolution Volatility Bands with Range Contraction' indicator.
It highlights (dark blue) in case of rangebound moves.
(vice-versa for buyers)
(8/N)
Are you an options seller who looks for range-bound moves to sell both CE &PE?
Use the 'Revolution Volatility Bands with Range Contraction' indicator.
It highlights (dark blue) in case of rangebound moves.
(vice-versa for buyers)
(8/N)

#8 Identify Candlestick Pattern
Are you a trader who trades only a particular candlestick pattern?
Search your pattern in indicators. It highlights when your pattern occurs!
(9/N)
Are you a trader who trades only a particular candlestick pattern?
Search your pattern in indicators. It highlights when your pattern occurs!
(9/N)

#9 Follow Dow Theory
Most traders use 'Dow Theory' Concepts in their Trading (nothing but higher high and lower low).
We can get that info in tradingview by selecting the 'Higher High Lower Low Strategy' indicator!
(10/N)
Most traders use 'Dow Theory' Concepts in their Trading (nothing but higher high and lower low).
We can get that info in tradingview by selecting the 'Higher High Lower Low Strategy' indicator!
(10/N)

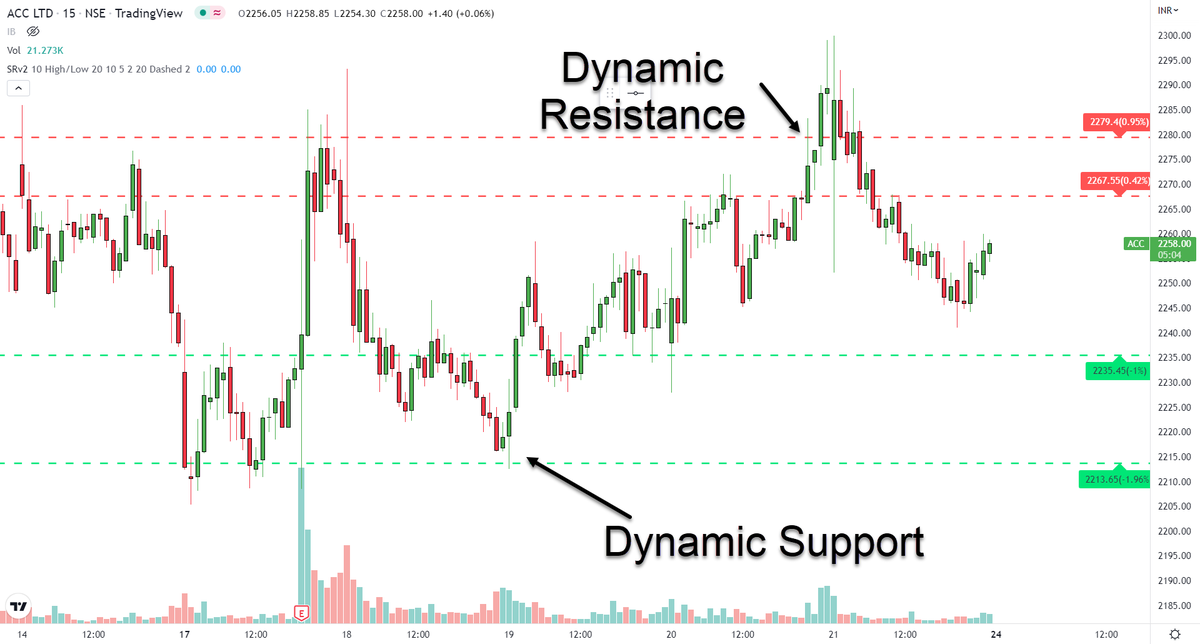
#10 Dynamic Support & Resistance
Short-term traders have a tough time identifying support & resistance levels in lower timeframes
Such traders can use 'Support Resistance Dynamic V2' indicator which plots support in green lines &resistance in red lines in any timeframe!
(11/N)
Short-term traders have a tough time identifying support & resistance levels in lower timeframes
Such traders can use 'Support Resistance Dynamic V2' indicator which plots support in green lines &resistance in red lines in any timeframe!
(11/N)
Sharing is Caring!
If you think this thread is useful:
1. Follow me @indraziths for more threads on the stock market trading
2. RT the tweet below to share this thread with your audience
3. Also, check my articles on various stock market topics here
profiletraders.in/blog
If you think this thread is useful:
1. Follow me @indraziths for more threads on the stock market trading
2. RT the tweet below to share this thread with your audience
3. Also, check my articles on various stock market topics here
profiletraders.in/blog
• • •
Missing some Tweet in this thread? You can try to
force a refresh