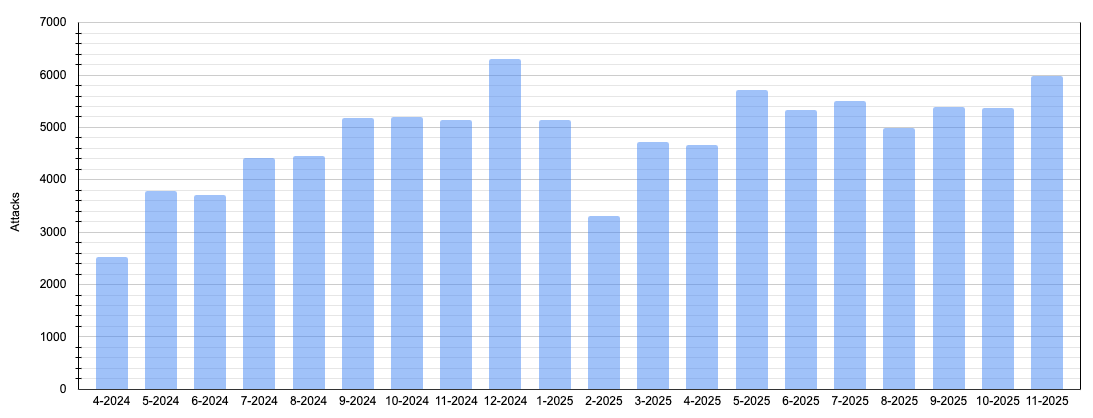
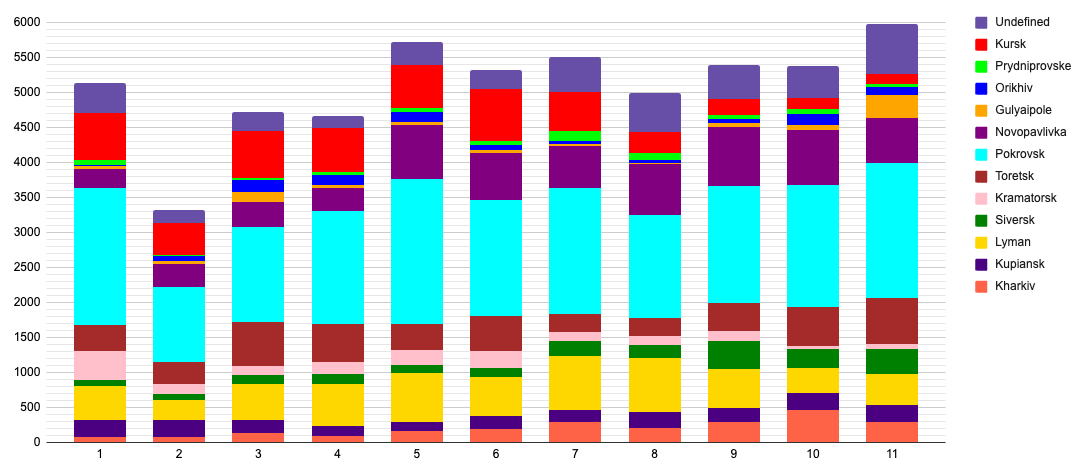
Pokrovsk is the most data-rich direction, as GSUA publishes detailed reports about enemy activities in the area.
Every evening, GSUA publishes attacks and losses, showing 5-8 casualties per attack, with a noticeable correlation.
The ratio of casualties to attacks started to change after March 20, as summertime began to affect the morning and evening reporting of data.
A lot of attacks have been occurring at dusk, that will diverge the data sets.
What about the comparison of absolute numbers?
Almost every third attack happens in Pokrovsk,
but only 20% of Ivans are reported from that direction, making it seem cost-effective.
That doesn’t match the visual evidence.
By the end of November, the future appeared grim. However, recent successful operations by the AFU have brought a glimmer of hope, stabilizing the front lines pushing back the enemy.
Despite these positive developments, the battle is far from over.
0/13
1/ After stabilizing the Kursk axis, Russia may shift its focus to Pokrovsk, aiming to secure the Malynivka road junction and the Udachne mine to sustain offensive momentum.
2/ Meanwhile, AFU are working to push Russian units beyond the Solona River and maintain control over the M04 and T0515 roads, which are critical for logistics and maneuverability.
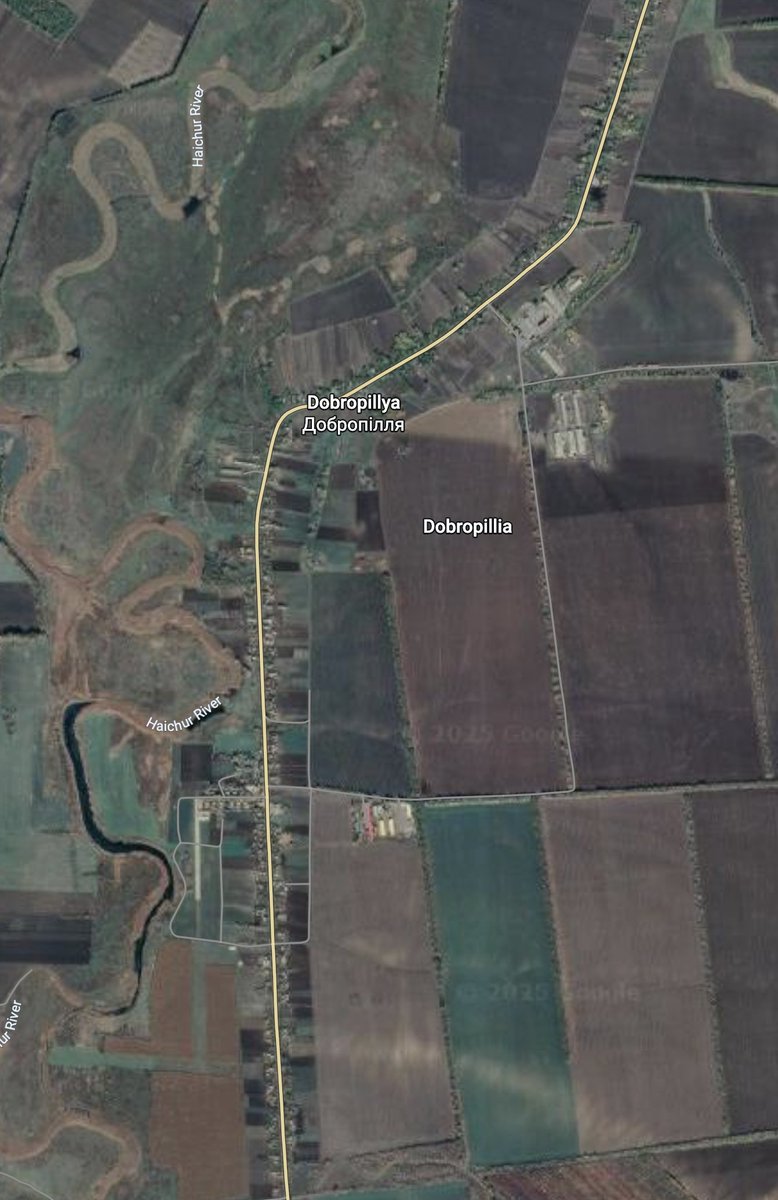
Ukraine can also prepare some alternative path to M04 over the fields towards Dobropillia.
1/9 Threw russian reports into GSUA data to find some patterns.
New battlefield correlation data reveals fascinating insights into Russia's war tactics and reporting patterns. This matrix exposes key relationships - and potential misinformation - in combat operations.
2/9 Russian territorial gains strongly link with their attacks and troop losses. This confirms the "costly advance" pattern - Russia gaining ground primarily through persistent attacks and willingness to accept casualties.
3/9 What's striking is the disconnect between Russian advances and Ukrainian equipment losses. These operate as separate clusters with minimal relationship, suggesting Russia's territorial gains aren't achieved through equipment superiority.
0/7 Analyzing russia's combat efficiency in Ukraine through correlation data.
This matrix reveals key relationships between russian tactics, losses, and territorial gains - providing statistical evidence of what's working and failing on the battlefield.
1/7 Analysis of Russian losses in Ukraine reveals telling patterns. Combat engagements (repelled Russian attacks) strongly correlate with Russian troop losses (0.60), confirming the high casualty rate of offensive operations against prepared positions.
2/7 Russian guided bomb (KAB) usage shows negative correlation (-0.27) with combat engagements, suggesting these weapons are deployed separately from ground assaults, likely targeting rear areas while infantry attacks elsewhere.
#4Fun
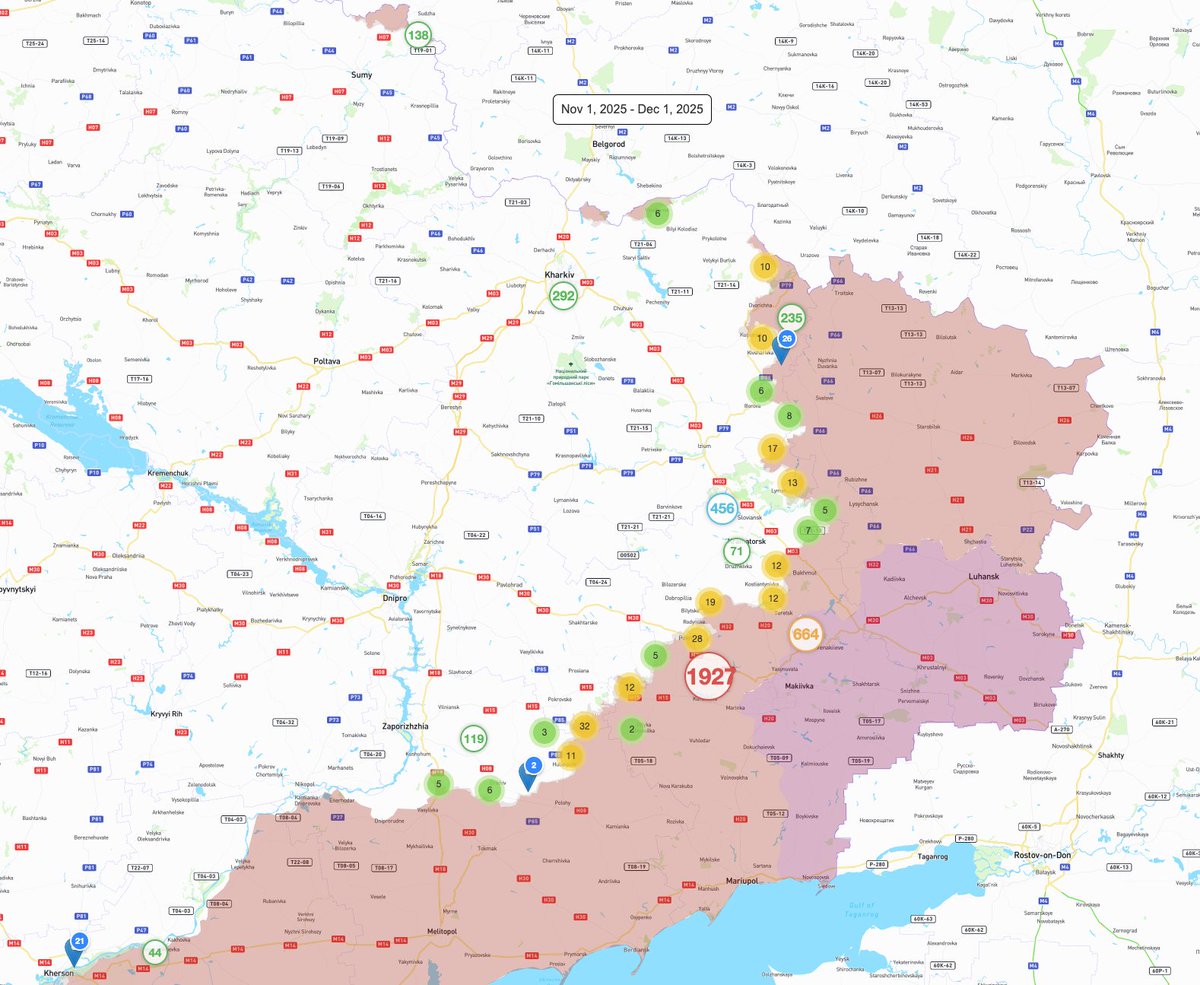
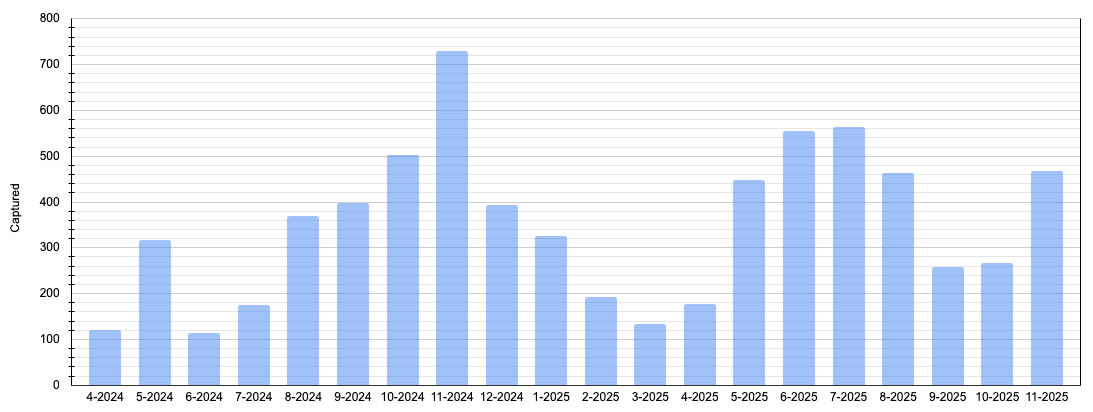
There are 3 interconnected graphics: the number of repelled attacks and Russian losses @GeneralStaffUA
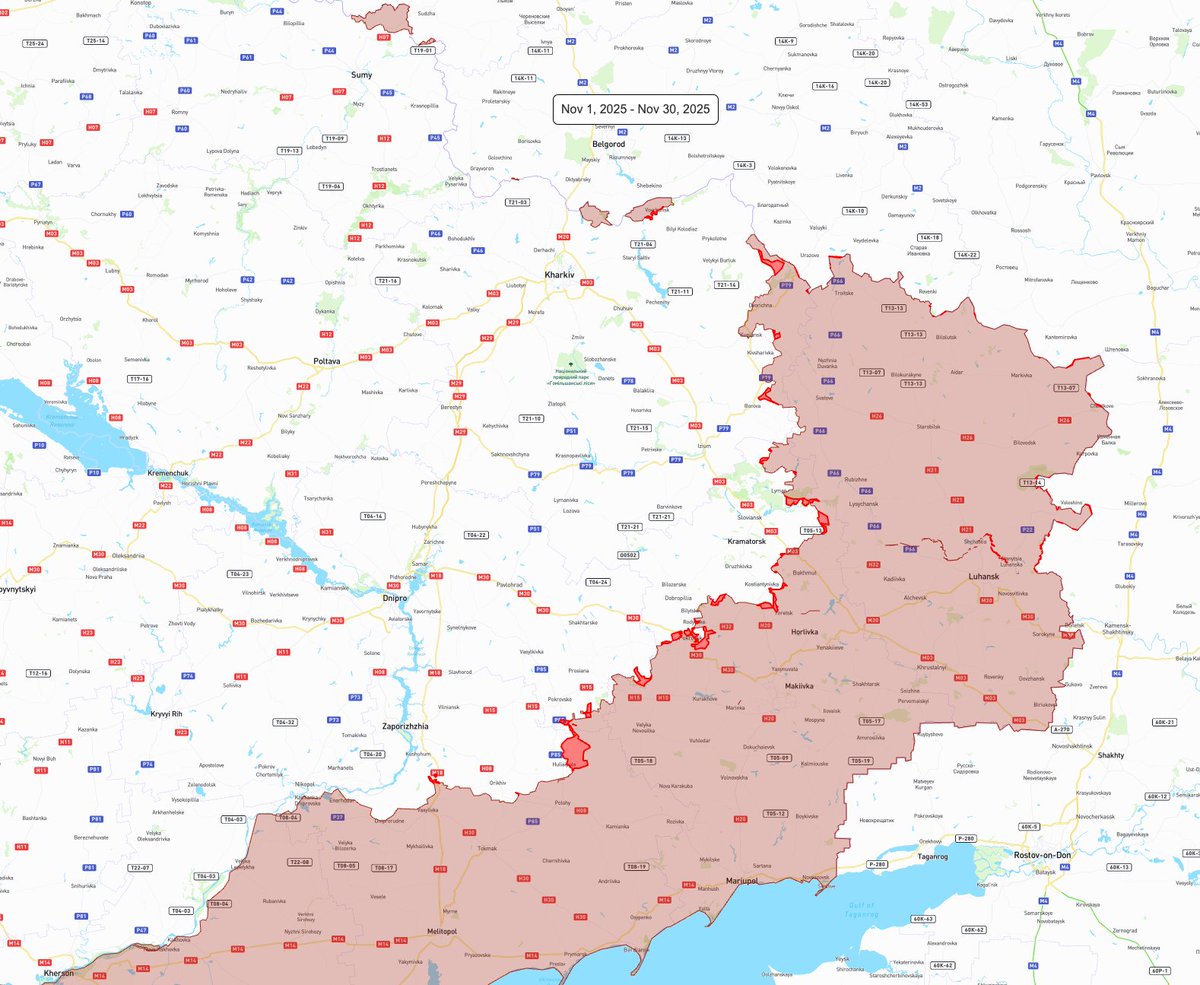
and territorial changes by @Deepstate_UA
While the raw data is difficult to interpret, applying a 7-day average reveals some patterns.
The DS data has some lag and may require adjustments, but it offers valuable context, particularly for interpreting the number of unrepelled attacks. Since September, there have been five distinct spikes in Russian losses.
Notably, the correlation between attack spikes and loss spikes began to diverge after the Russian Kursk operation, shifting the losses wave function by approximately seven days relative to repelled attacks.
#Thoughts
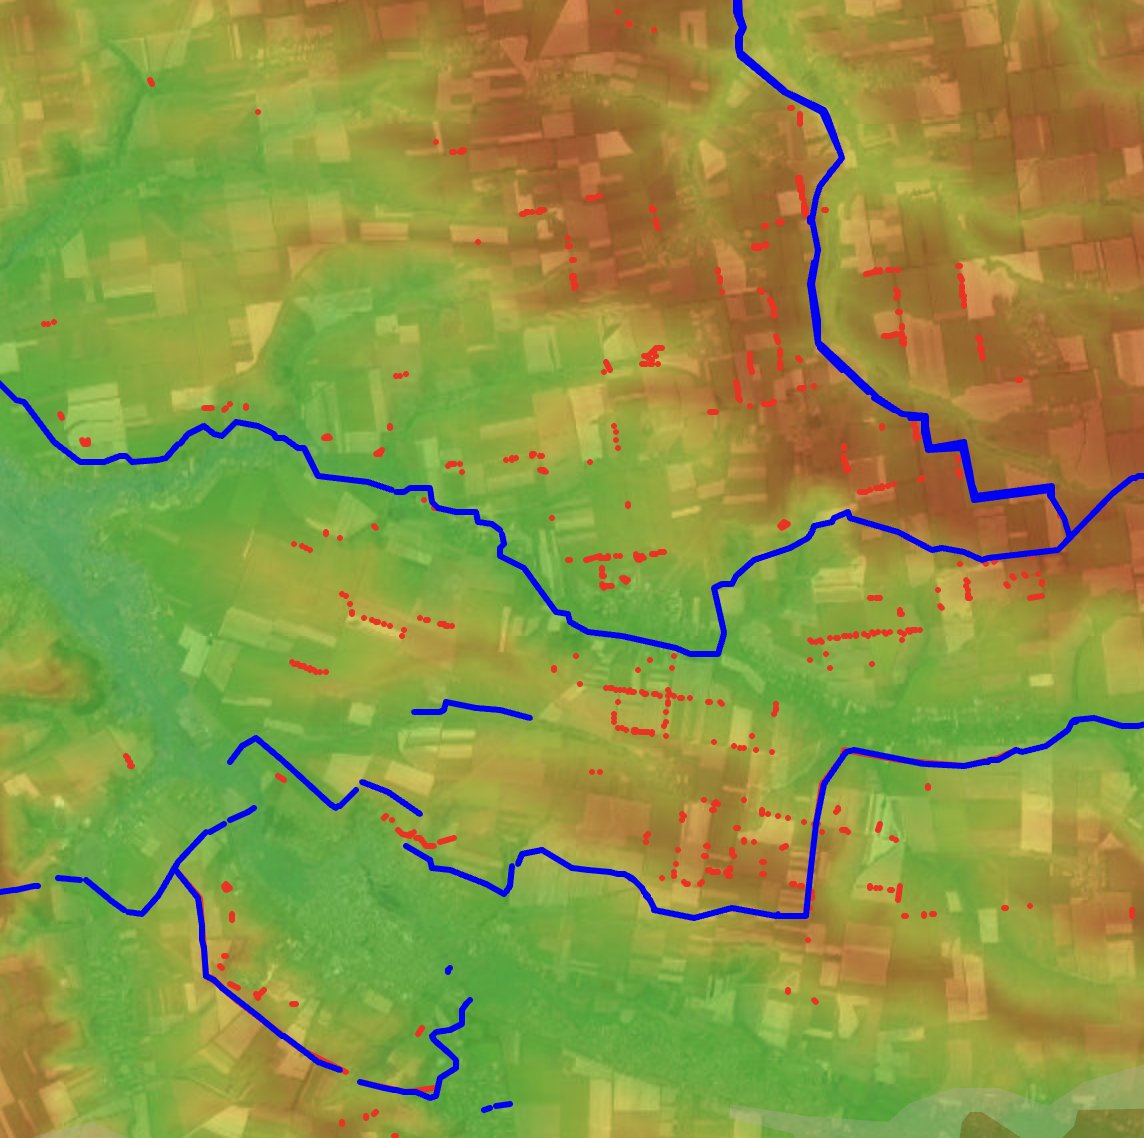
🇷🇺 "Lost" fortification section on the Volnovakha front.
There must be at least two lines.
Majority of 🇷🇺 fortifications are build on the hill behind the water stream and the link between those valleys.
For some reason second line is missing on the Vremiivskiy lendge.
Without control of Vuhledar there was no chance to build anything along Kashlahach river.
The ledge made the area too deep to justify the construction 25km away from the front.
Incomplete uneven fronts complicates and hight expectations postponed the decision, So non were build.
While @Nrg8000 map shows a continuous lines of fortifications. @AndrewPerpetua use dots in the data representation.