Even with the $20B drop in Fed balance sheet yesterday, #NetLiquidity is still up yesterday and today. 

Projected TGA change in tomorrow's report:
+$143B
Also keep in mind the QT over the next three Thursdays:
-$19B
-$17B
-$39B
+$143B
Also keep in mind the QT over the next three Thursdays:
-$19B
-$17B
-$39B
https://twitter.com/Johncomiskey77/status/1668237556071235585


RRP +$19B


TGA +$115B
RRP back above $2T
RRP back above $2T


TGA trajectory updated
Next big TGA public debt changes according to @TreasuryDirect data:
Tue +$49B
Thu +$68B
As usual, remember that these show up in the following day's DTS.
Tue +$49B
Thu +$68B
As usual, remember that these show up in the following day's DTS.

China Central Bank balance sheet:
-$623B CNY
1.5% drop
This is for May.
$CNCBBS
-$623B CNY
1.5% drop
This is for May.
$CNCBBS

RRP -$22B
Back under $2T ($1.989T)
Back under $2T ($1.989T)


TGA +$16B


RRP +$47B
RRP back above $2T
RRP back above $2T


TGA +$61B


TGA trajectory updated

RRP -$42B
RRP back below $2T
https://t.co/kxLWcmT02q https://t.co/FGfoz1o46bquickchart.io/chart-maker/vi…
quickchart.io/chart-maker/vi…
RRP back below $2T
https://t.co/kxLWcmT02q https://t.co/FGfoz1o46bquickchart.io/chart-maker/vi…
quickchart.io/chart-maker/vi…


Data from @TreasuryDirect is showing the following public debt changes for next week:
Tue +$59B
Thu +$59B
Fri +$31B
Tue +$59B
Thu +$59B
Fri +$31B

TGA -$35B
https://t.co/PqzvzUswF1 https://t.co/K9wKStZM0yquickchart.io/chart-maker/vi…
quickchart.io/chart-maker/vi…
https://t.co/PqzvzUswF1 https://t.co/K9wKStZM0yquickchart.io/chart-maker/vi…
quickchart.io/chart-maker/vi…


Fed balance sheet changes this week
WDTGAL +$157B (TGA)
WLRRAL -$66B (RRP)
WLODLL -$102B
While RRP dropped $66B to accommodate the $157B build in TGA, WLODLL (Other Deposits Held by Depository Institutions) fell even more, $102B.
quickchart.io/chart-maker/vi…
WDTGAL +$157B (TGA)
WLRRAL -$66B (RRP)
WLODLL -$102B
While RRP dropped $66B to accommodate the $157B build in TGA, WLODLL (Other Deposits Held by Depository Institutions) fell even more, $102B.
quickchart.io/chart-maker/vi…

RRP -$25B


TGA +$74B


RRP -$8B


TGA +$10B


Data from @TreasuryDirect is showing the following TGA public debt increases this week:
Tue +$59B
Thu +$69B
Fri +$31B
Values expected on the following day's report.
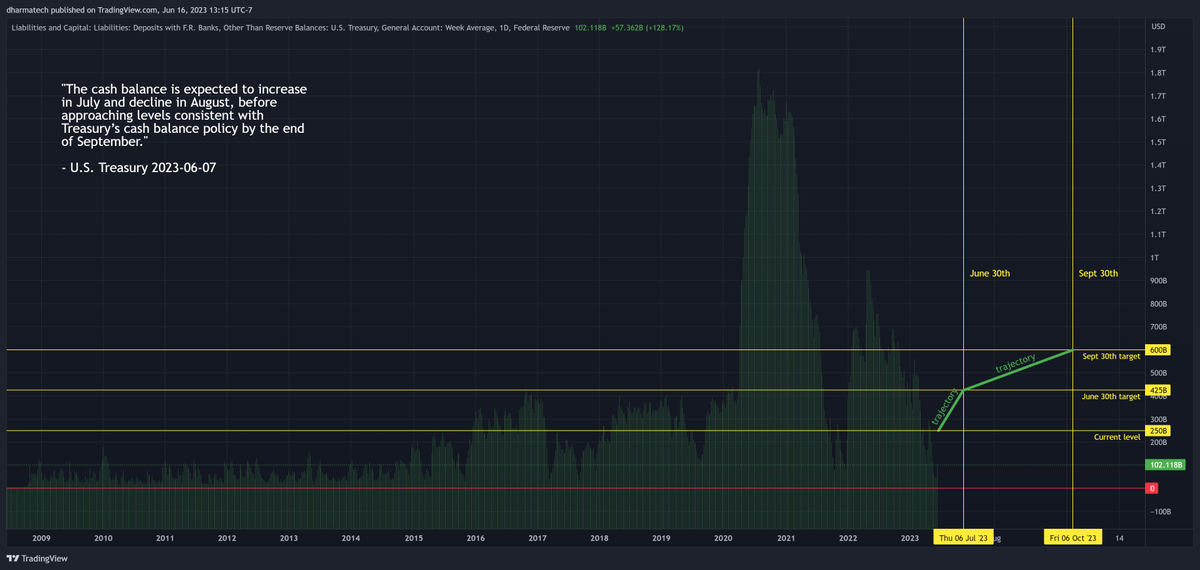
That will wrap up June and, in theory, bring TGA up to the $425B goal of June 30th.
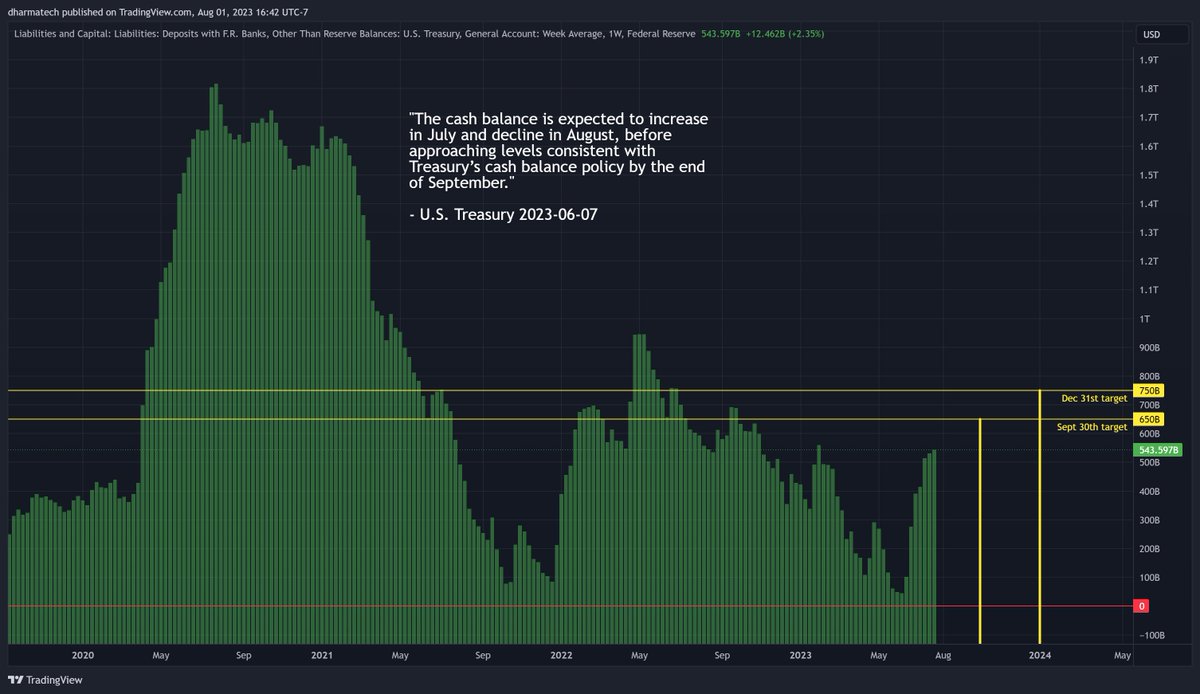
Then we begin the slower grind to $600B by Sept 30th.
Treasury says TGA expected to decline in Aug.
Tue +$59B
Thu +$69B
Fri +$31B
Values expected on the following day's report.
That will wrap up June and, in theory, bring TGA up to the $425B goal of June 30th.
Then we begin the slower grind to $600B by Sept 30th.
Treasury says TGA expected to decline in Aug.


RRP -$9.9B


Friendly reminder:
The next three days are the last days of June.
Which is month end and quarter end.
Which means, RRP is expected to rise possibly starting tomorrow and falling on the 1st due to window-dressing.
Highlighted below are the last 3 quarter ends.
Just warning everyone before people freak out about the liquidity drain. Consider it temporary until you really know the damage after the 1st.
Interesting thing is, there are @TreasuryDirect auctions today, Thu, and Fri.
It will be interesting to see if there's any contention between quarter-end window-dressing and these bill purchases.


TGA +$11B


TGA trajectory updated

RRP -$5.8B


TGA +$49B


RRP -$10B
They're really waiting till the last minute to dress the windows.😅Tomorrow's the last day to get that done.
They're really waiting till the last minute to dress the windows.😅Tomorrow's the last day to get that done.


WALCL -$21B
TGA -$29B
Usual large withdrawal from TGA for SSA - Benefits Payments.
TGA -$29B
Usual large withdrawal from TGA for SSA - Benefits Payments.


RRP +$99B
Above $2T again.
This is the expected end-of-quarter window-dressing.
Look for it to drop next week.
Above $2T again.
This is the expected end-of-quarter window-dressing.
Look for it to drop next week.


TGA +$56B


Data from @TreasuryDirect showing the following TGA public debt changes for next week:
Wed: +$60B
Thu: +$59B
Wed: +$60B
Thu: +$59B

RRP -$124B
As expected, RRP has dropped back down after end-of-quarter window dressing last Friday.
As expected, RRP has dropped back down after end-of-quarter window dressing last Friday.


TGA -$62B
Despite the +$32B in public debt, withdrawals outweighed it.
TGA is back below the $425B target for June 30th.
Despite the +$32B in public debt, withdrawals outweighed it.
TGA is back below the $425B target for June 30th.


Bank of Japan total assets -1.7%
$JPNASSETS
$JPNASSETS

RRP -$42B
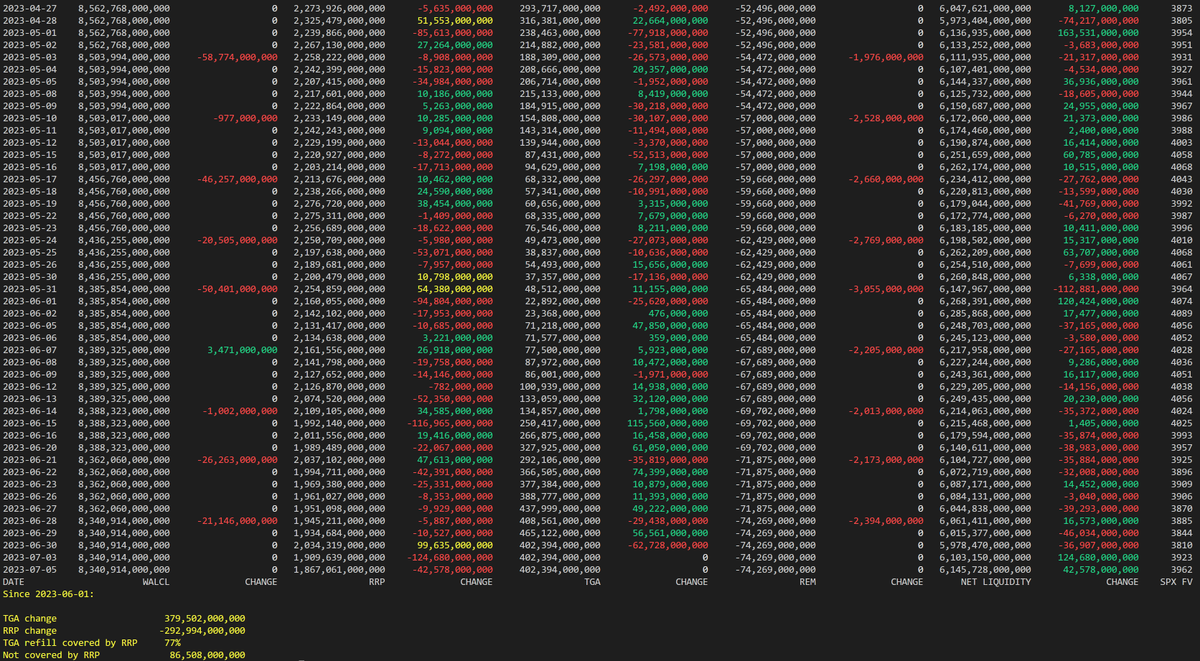
TGA refill covered by RRP: 77%
https://t.co/oBblWvvQezquickchart.io/chart-maker/vi…
quickchart.io/chart-maker/vi…
TGA refill covered by RRP: 77%
https://t.co/oBblWvvQezquickchart.io/chart-maker/vi…
quickchart.io/chart-maker/vi…


GNL at Oct 2022 level
FRED:WALCL+FRED:JPNASSETS*FX_IDC:JPYUSD+ECONOMICS:CNCBBS*FX_IDC:CNYUSD+FRED:ECBASSETSW*FX:EURUSD-FRED:RRPONTSYD-FRED:WTREGEN
FRED:WALCL+FRED:JPNASSETS*FX_IDC:JPYUSD+ECONOMICS:CNCBBS*FX_IDC:CNYUSD+FRED:ECBASSETSW*FX:EURUSD-FRED:RRPONTSYD-FRED:WTREGEN

$ECBASSETSW drops 6.37%

TGA -$7B
TGA refill covered by RRP: 79%
https://t.co/JfXyflKiv4quickchart.io/chart-maker/vi…
quickchart.io/chart-maker/vi…
TGA refill covered by RRP: 79%
https://t.co/JfXyflKiv4quickchart.io/chart-maker/vi…
quickchart.io/chart-maker/vi…


Data from @TreasuryDirect is showing these public debt changes for next week:
Tue: +$43B
Thu: +$7B
Which seems like a light week.
But $91B are maturing on Sat the 15th.
And Mon the 17th we have +$90B.
Tue: +$43B
Thu: +$7B
Which seems like a light week.
But $91B are maturing on Sat the 15th.
And Mon the 17th we have +$90B.

RRP -$12.8B
TGA refill covered by RRP: 82%
TGA refill covered by RRP: 82%


TGA +$52B
TGA refill covered by RRP: 72%
TGA refill covered by RRP: 72%


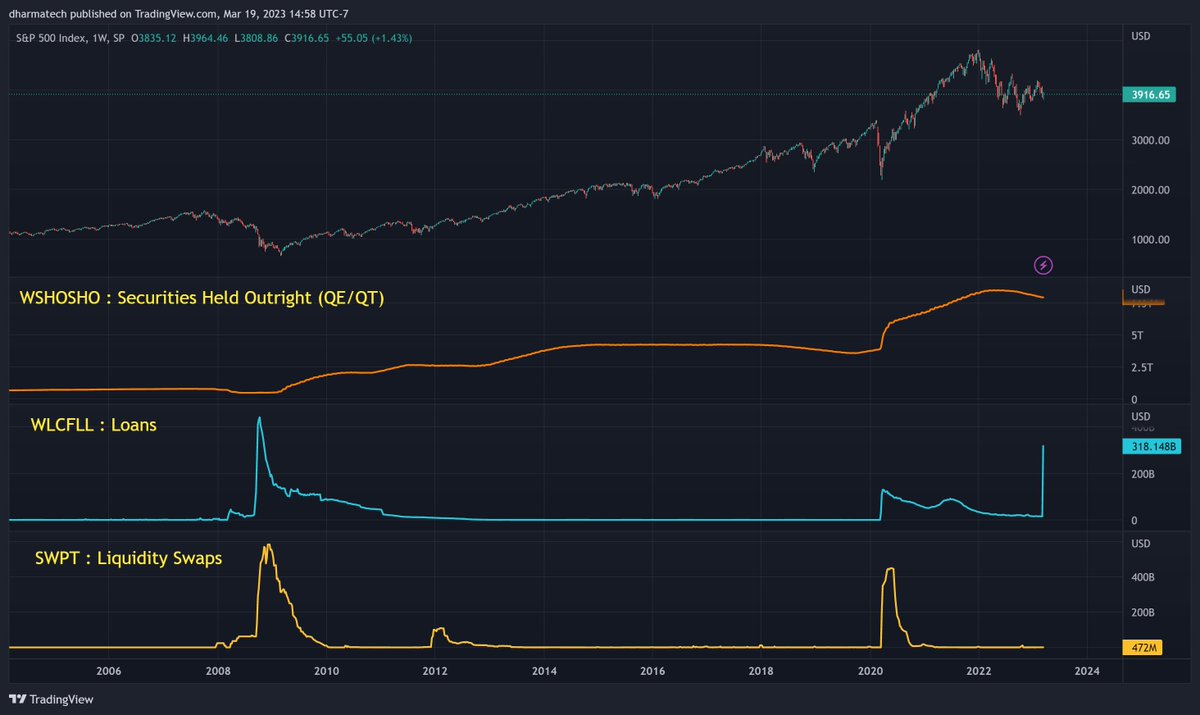
WALCL: -$42B


Fed balance sheet changes
Note that the large drop in RRP was not only balanced by an increase in TGA, but a drop in notes and bonds on the assets side.
https://t.co/Sdic4Fkqxxquickchart.io/chart-maker/vi…
Note that the large drop in RRP was not only balanced by an increase in TGA, but a drop in notes and bonds on the assets side.
https://t.co/Sdic4Fkqxxquickchart.io/chart-maker/vi…

RRP -$31B
TGA refill covered by RRP: 80%
TGA refill covered by RRP: 80%


TGA +$66B
TGA refill covered by RRP 69%
TGA refill covered by RRP 69%


RRP continues to drop
RRP -$36B
TGA refill covered by RRP: 80%
RRP -$36B
TGA refill covered by RRP: 80%


RRP +$44B
TGA refill covered by RRP: 70%
First increase in RRP in 21 days.
(Excluding window-dressing.)
TGA refill covered by RRP: 70%
First increase in RRP in 21 days.
(Excluding window-dressing.)


TGA +$31B
TGA refill covered by RRP: 65%
TGA refill covered by RRP: 65%


WALCL -$1.4B
RRP -$52B
TGA -$25B
REM -$1.5B
TGA refill covered by RRP: 79%
https://t.co/skdAQ1E2KVquickchart.io/chart-maker/vi…
quickchart.io/chart-maker/vi…
RRP -$52B
TGA -$25B
REM -$1.5B
TGA refill covered by RRP: 79%
https://t.co/skdAQ1E2KVquickchart.io/chart-maker/vi…
quickchart.io/chart-maker/vi…


🚨PBoC balance sheet up 2.86%
$CNCBBS :
Global Net Liquidity has bounced off of $24.59T:
$CNCBBS :
Global Net Liquidity has bounced off of $24.59T:


RRP +$49B
TGA refill covered by RRP: 76%
No idea if it's a coincidence or not but, RRP has been hanging out around that lower red line for 4 days, which is the level that was required for RRP to 100% cover TGA refill through June plus the theoretical maximum QT through June.
If Fed raises rates next week, keep a close eye on what RRP does, and also what the 1 month yield does.
SPX FV chart:

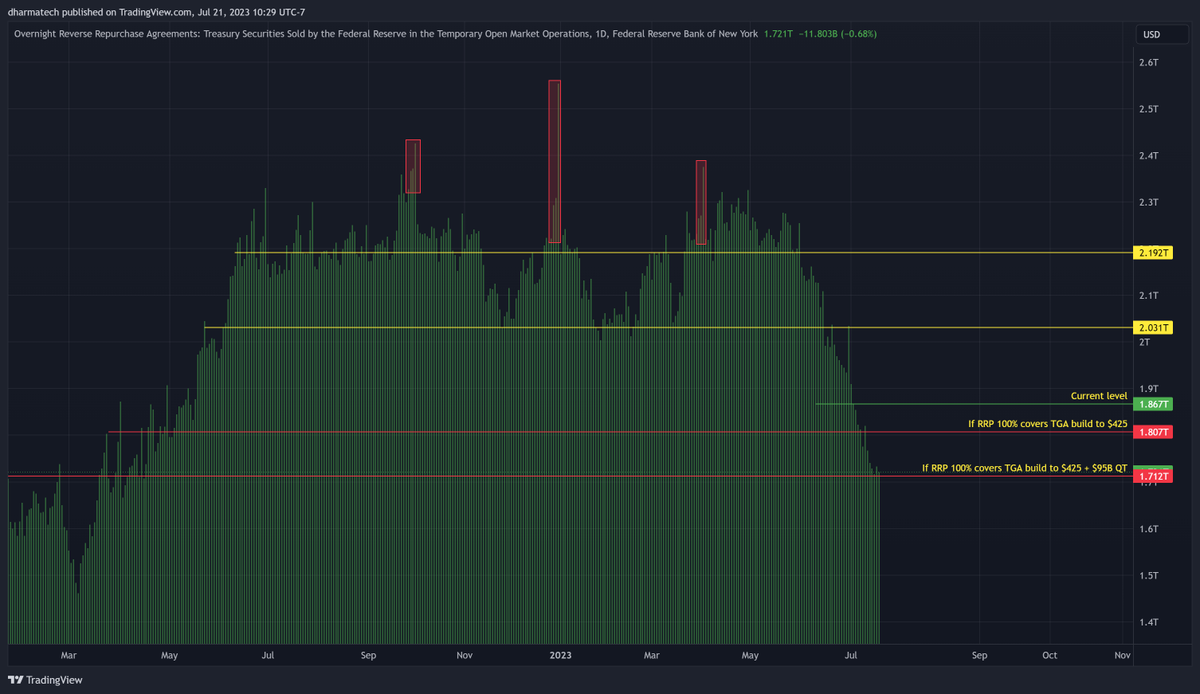

RRP has remained above $1.71T for around 10 days now.
As I mentioned previously, this just happens to be the level that RRP would have to drop to to cover TGA refill through June plus the theoretical maximum QT through June.
It fell continuously and dramatically for 40 days before arriving here.
There doesn't appear to be any large TGA public debt changes through next Thursday. (-43B on Mon, but then +$35B Tue.) This could be a slow drain of TGA for Aug that the treasury referred to.
Let's see if $1.71T holds for RRP.

Reminder:
RRP is likely to increase today due to end-of-month window-dressing. Look for it to drop back down on Tue.
RRP is likely to increase today due to end-of-month window-dressing. Look for it to drop back down on Tue.
https://twitter.com/dharmatrade/status/1598140777280180224
RRP +$90B (EOM window-dressing)
Let's see what it falls back down to tomorrow.
At EOQ in June, it went up $99B.
EOQ is usually higher than EOM, so this is relatively high for EOM.
Let's see what it falls back down to tomorrow.
At EOQ in June, it went up $99B.
EOQ is usually higher than EOM, so this is relatively high for EOM.

The @USTreasury published their TGA targets for 3rd and 4th quarters.
Sept 30st: $650B
Dec 31st: $750B
They plan to borrow as follows:
3rd quarter: $1.007T
4th quarter: $852B
As of today, TGA balance is at $501B.
Sept 30st: $650B
Dec 31st: $750B
They plan to borrow as follows:
3rd quarter: $1.007T
4th quarter: $852B
As of today, TGA balance is at $501B.

RRP -$81B
TGA -$48B
RRP still holding above $1.71T.
TGA -$48B
RRP still holding above $1.71T.


And thanks to @Entertained_1 and @ScapeTheMatrix for bringing the press release to my attention yesterday! 👍
Fed assets: -$36B
I added more stats related to the TGA refill to net-liquidity.ps1. See console output below.
TGA change needed to hit targets:
Sept 30th: $189 B days: 57 amount per day: $3.3 B
Oct 31th: $289 B days: 88 amount per day: $3.3 B
Script:
I added more stats related to the TGA refill to net-liquidity.ps1. See console output below.
TGA change needed to hit targets:
Sept 30th: $189 B days: 57 amount per day: $3.3 B
Oct 31th: $289 B days: 88 amount per day: $3.3 B
Script:


RRP +$16B
Up 4 days in a row now.
Hasn't done that 3 months (since May).
Up +$70B in these 4 days.
Back above $1.8T.
But remember, TGA expected to fall this Month.
So they're offsetting each other to some degree.
NL moving sideways-ish for around 46 days.
TGA refill expected to continue in 4 weeks.
Up 4 days in a row now.
Hasn't done that 3 months (since May).
Up +$70B in these 4 days.
Back above $1.8T.
But remember, TGA expected to fall this Month.
So they're offsetting each other to some degree.
NL moving sideways-ish for around 46 days.
TGA refill expected to continue in 4 weeks.


$DXY causing GNL to test $24.6T
I'll be extremely surprised if GNL manages to fall through here.
Something has to give. If it doesn't, and GNL does fall through, I suspect it'll mean something has broken.
TradingView expression:
FRED:WALCL+FRED:JPNASSETS*FX_IDC:JPYUSD+ECONOMICS:CNCBBS*FX_IDC:CNYUSD+FRED:ECBASSETSW*FX:EURUSD-FRED:RRPONTSYD-FRED:WTREGEN

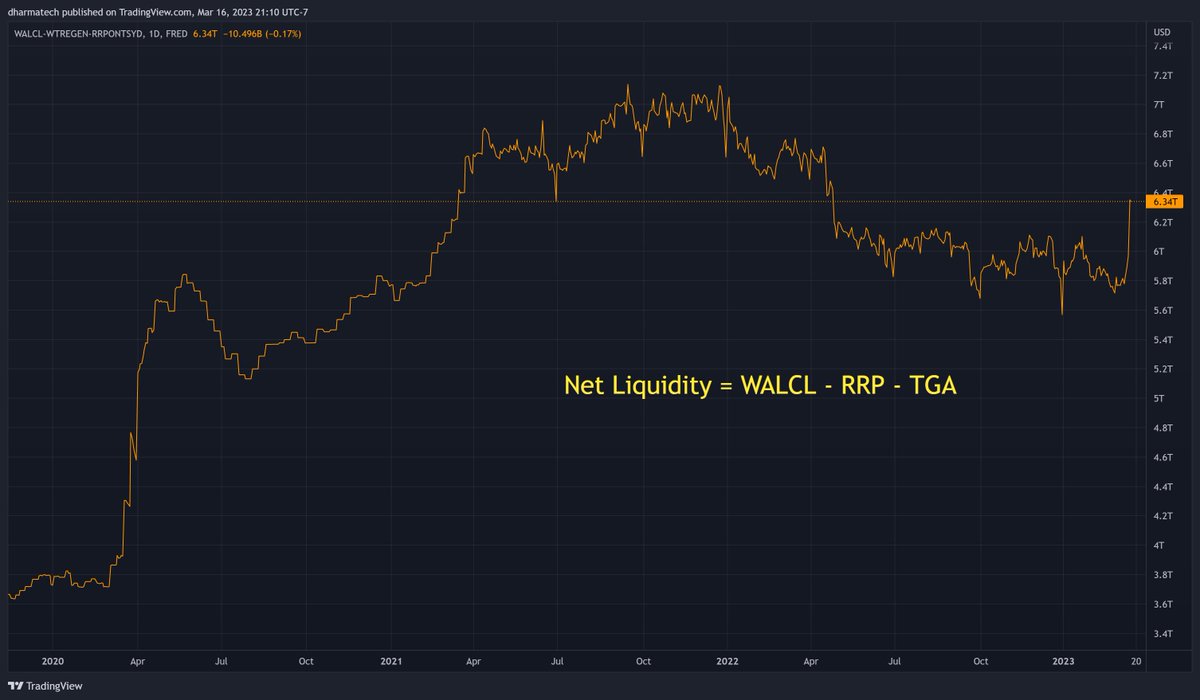
Net Liquidity has remained relatively flat for over a month now.
We have two more weeks before TGA begins to refill again. We'll then have to watch RRP to see if it drops to compensate.
TGA needs to grow at a rate of $4.2B per day to hit it's Sept 30th target.
SPX FV chart:
NL table:
https://t.co/eZt1zXuIP2
We have two more weeks before TGA begins to refill again. We'll then have to watch RRP to see if it drops to compensate.
TGA needs to grow at a rate of $4.2B per day to hit it's Sept 30th target.
SPX FV chart:
NL table:
https://t.co/eZt1zXuIP2


Huge drop in TGA: -$64B
Primarily due to 'Interest on Treasury Securities'.
Although, this isn't unexpected.
Every 3 months on the 15th,
there's a large withdrawal for
'Interest on Treasury Securities'.
See chart.
https://t.co/fxzh5Lpmzc
https://t.co/lcQfaLcRmPdharmatech.dev/data/reports/n…
dharmatech.dev/data/reports/t…
Primarily due to 'Interest on Treasury Securities'.
Although, this isn't unexpected.
Every 3 months on the 15th,
there's a large withdrawal for
'Interest on Treasury Securities'.
See chart.
https://t.co/fxzh5Lpmzc
https://t.co/lcQfaLcRmPdharmatech.dev/data/reports/n…
dharmatech.dev/data/reports/t…


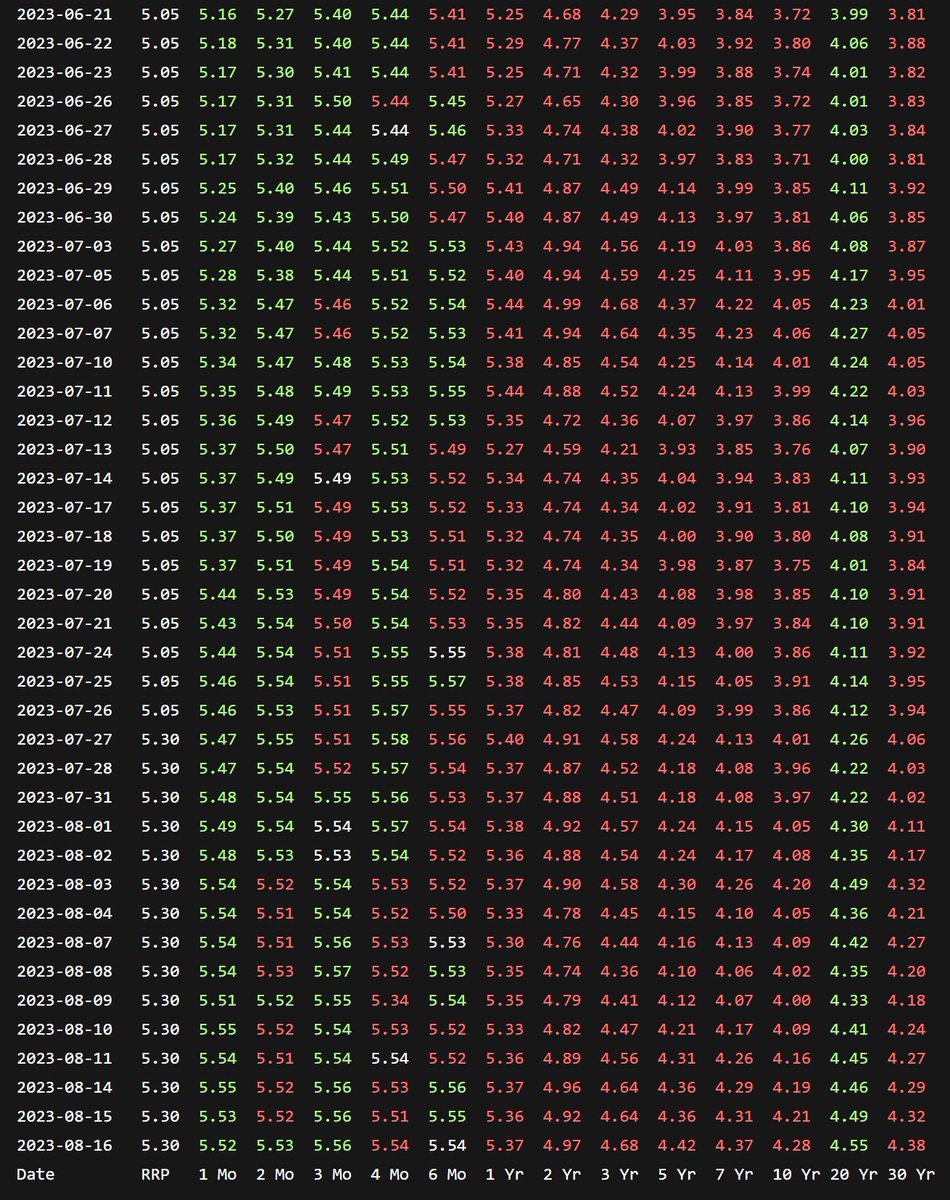
US Treasury Securities Yield Curve
Purple: today
Yellow: yesterday
Green: month ago
Chart:
Table:
https://t.co/vOpfBGKl3kdharmatech.dev/data/reports/u…
dharmatech.dev/data/reports/u…
Purple: today
Yellow: yesterday
Green: month ago
Chart:
Table:
https://t.co/vOpfBGKl3kdharmatech.dev/data/reports/u…
dharmatech.dev/data/reports/u…

The Jaws of Liquidity are closing
Specifically, the upper jaw of $SPX is falling.
The bottom jaw of NL is still moving sideways.
SPX FV chart:
The NL table report now includes some data related to the Sep and Oct TGA refill targets, including what RRP would have to fall to in order to 100% cover the TGA refill.
NL table report:
https://t.co/eZt1zXuIP2
But wait, there's more...
The NL chart visually shows what RRP will have to fall to in order to 100% cover the TGA refill (yellow and purple lines). You'll have to toggle the 'RRP' chart on via the legend to get this view.
NL chart:
https://t.co/vkWIJ80jCi
The charts linked above are scheduled to update twice daily after the RRP and TGA numbers are available.
OK, onto the data:
TGA has to grow $6.2B per day to hit the Sep 30th target.
RRP would have to drop to $1.529T to offset this.
If there's not another banking crisis that causes the Fed to pump its assets with loans, it will be up to the RRP alone to offset the TGA build. So... watch the RRP closely, especially starting Sep 1st.
Please note: I'm not saying SPX has any guarantee or hope of hitting any of the FV lines. I just think it's interesting to note how far above these levels SPX has moved. It'll take some time to sort out what the "new normal" is.dharmatech.dev/data/reports/s…


• • •
Missing some Tweet in this thread? You can try to
force a refresh