dharmafi Profile picture
David Profile picture 1 subscribed
Mar 13 4 tweets 2 min read
This chart 'US Equity Holdings to Liquidity' was presented by @crossbordercap in his recent interview with @menlobear.

Something similar that I've been tracking on @tradingview is simply $SPX/#NetLiquidity

Formula for @tradingview:

SP:SPX/(FRED:WALCL-FRED:WTREGEN-FRED:RRPONTSYD)*1000*1000*1000*10

It tells you how far $SPX is extended with respect to #NetLiquidity. As you can see, it's the most extended it's been since 2020 right before the crash.Image
Image
The interview, which I highly recommend is here:

Sep 1, 2023 5 tweets 3 min read
Was looking through the mean reversion system described by @TheMeanTrader

I cooked up a TradingView indicator that signals when:

Bollinger bands are outside Keltner Channel
Price is near Bollinger band
di+ and di- confirmation
RSI confirmation

Signals are shown as yellow triangles below.
(Circled in white to identify them.)

Takes the hassle out of manually validating the criteria.
Image 
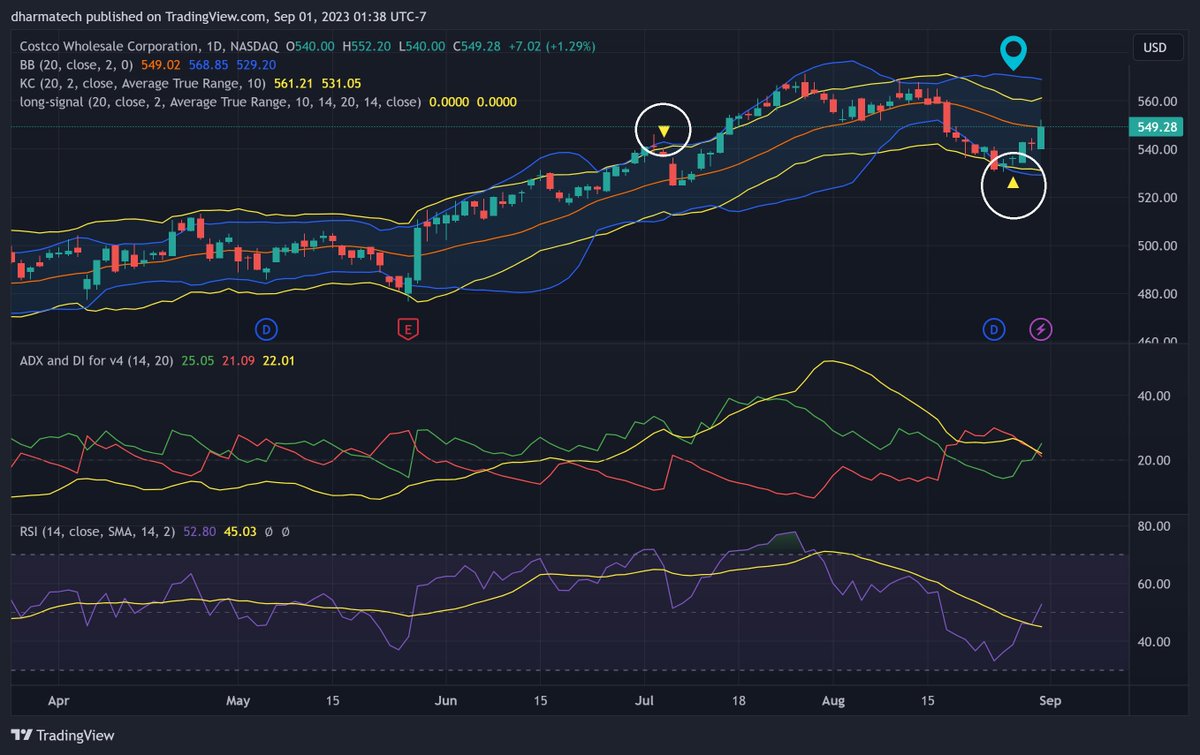
The indicator is signaling bearish today on $NVDA. Image
Jun 23, 2023 8 tweets 4 min read
Michael Howell (@crossbordercap) mentioned that he's using an additional component as part of Net Liquidity:

Federal Reserve Operating Losses

To approximate this, I'm considering using the following FRED series:

https://t.co/foRIXQcJtyfred.stlouisfed.org/series/RESPPLL…
The formula would be:

NL = FED - RRP - TGA - REM

where REM is the above series.

I've tested a version of net-liquidity.ps1 that incorporates this.

Shown below are the differences.

NL is a bit elevated. SPX doesn't breach the upper band as much.
May 4, 2023 14 tweets 5 min read
Here's a thread exploring the Fed Balance Sheet and the Net Liquidity Formula, with an eye towards what on the liabilities side correlates with Net Liquidity.

Let's start here:

Many folks are familiar with the Fed Balance Sheet 'Total Assets' chart:

fred.stlouisfed.org/series/WALCL Image 
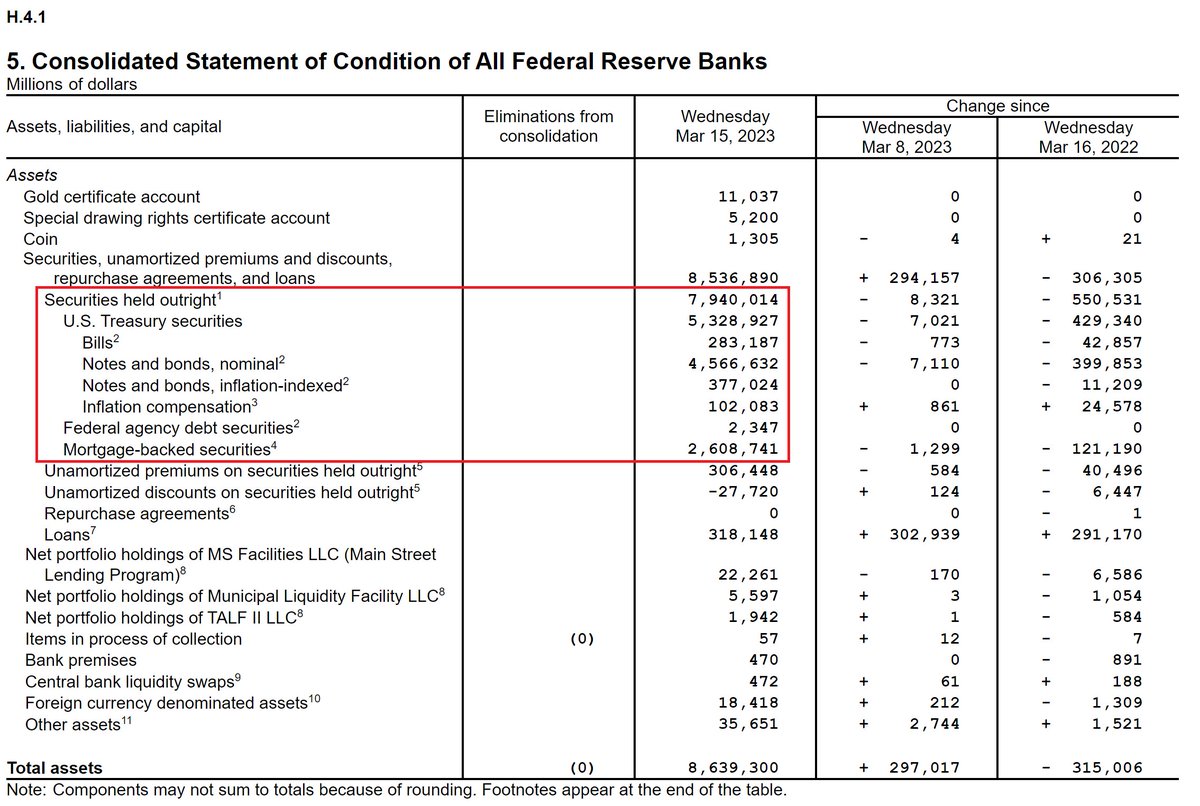
Towards the bottom of that page is a link to the following 'release table'.

This is a great page. It shows each component of the balance sheet, the current value, and a link to the chart.

fred.stlouisfed.org/release/tables… Image
Mar 19, 2023 5 tweets 2 min read
WLCFLL kicked in this week.

The Fed just announced that daily swap lines kick in on Monday. (SWPT)

Let's compare WSHOSHO, WLCFLL, and SWPT at various points in time and what happened to $SPX as a result. Image 2008 - Great Financial Crisis

Did market rally when WLCFLL kicked in? No.

Did market rally when SWPT kicked in? No.

Did the market rally when WSHOSHO kicked in? Yes. Image
Mar 17, 2023 6 tweets 4 min read
By now, you may have noticed that Net Liquidity defined as:

WALCL - RRP - TGA

has rocketed up due to BTFP.

Here's a TradingView formula for Net Liquidity which only includes the 'Securities Held Outright' portion of the Fed balance sheet.

WSHOSHO - RRPONTSYD -… twitter.com/i/web/status/1… ImageImageImage 
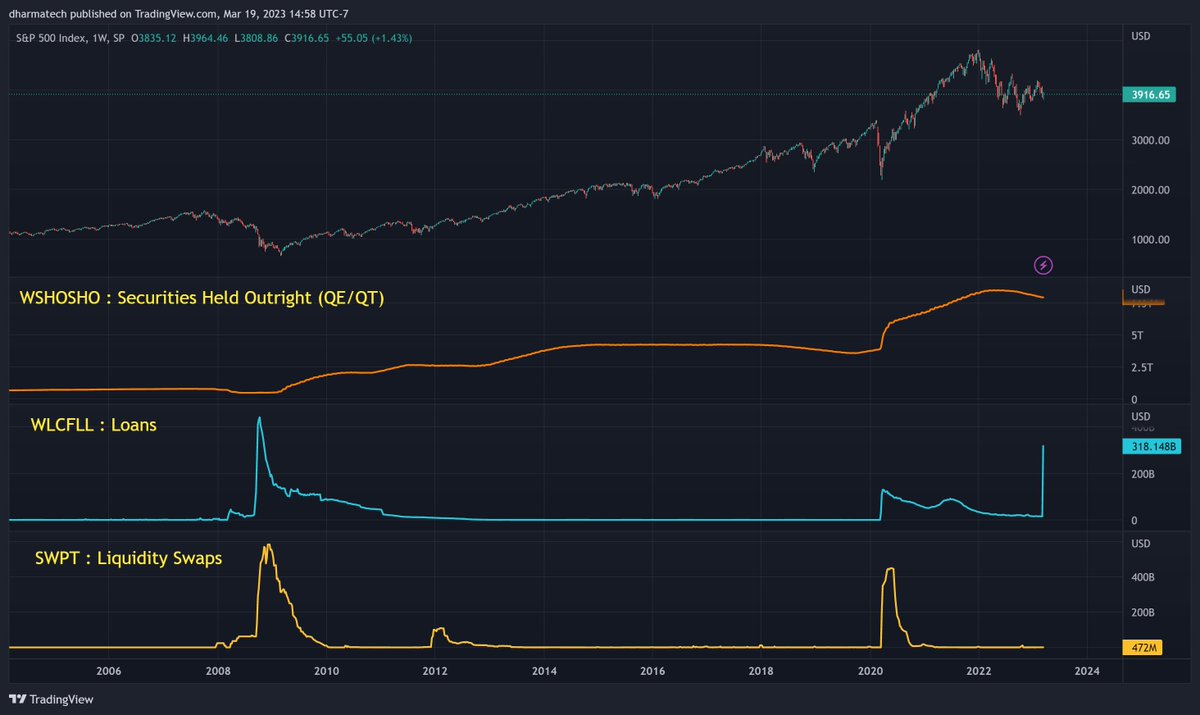
And here's an SPX Fair Value Bands indicator which uses WSHOSHO instead of WALCL.

So, if you are on team "BTFP is bullish", you can continue using the original indicator.

If you are on team "BTFP != BTFD", you can try out this new variation.

tradingview.com/script/MxhYLsA… Image
Feb 6, 2023 19 tweets 8 min read
Comparing SPX, Net Liquidity and Bank of Japan assets.

$JPNASSETS Image Messing around with an SPX Fair Value formula which incorporates JPNASSETS.

It get's pretty out of whack around Jul 2022.

TradingView formula if you want to experiment with it:

(FRED:WALCL + FRED:JPNASSETS/100 - FRED:WTREGEN - FRED:RRPONTSYD)/1000/1000/1000-10000+1000-400 Image
Oct 27, 2022 66 tweets 42 min read
Even with the $20B drop in Fed balance sheet yesterday, #NetLiquidity is still up yesterday and today. Image Projected TGA change in tomorrow's report:

+$143B

Also keep in mind the QT over the next three Thursdays:

-$19B
-$17B
-$39B


Oct 3, 2022 9 tweets 4 min read
Net Liquidity is described by @maxjanderson in the thread linked below.

The formula is:

Net Liquidity = Fed balance sheet - Treasury General Account - Reverse Repo

Net Liquidity can be plotted on TradingView

Sep 17, 2022 5 tweets 3 min read
Asian Contagion 1.0 Illustrated

Annotations from @UrbanKaoboy's thread on AC2:

More annotations on the chart from @UrbanKaoboy's thread

Mar 15, 2022 8 tweets 4 min read
Prices of some subscriptions services in finance.

Crypto related ones are by far the most expensive.

Indication of value? Or of fools in that space? Image 
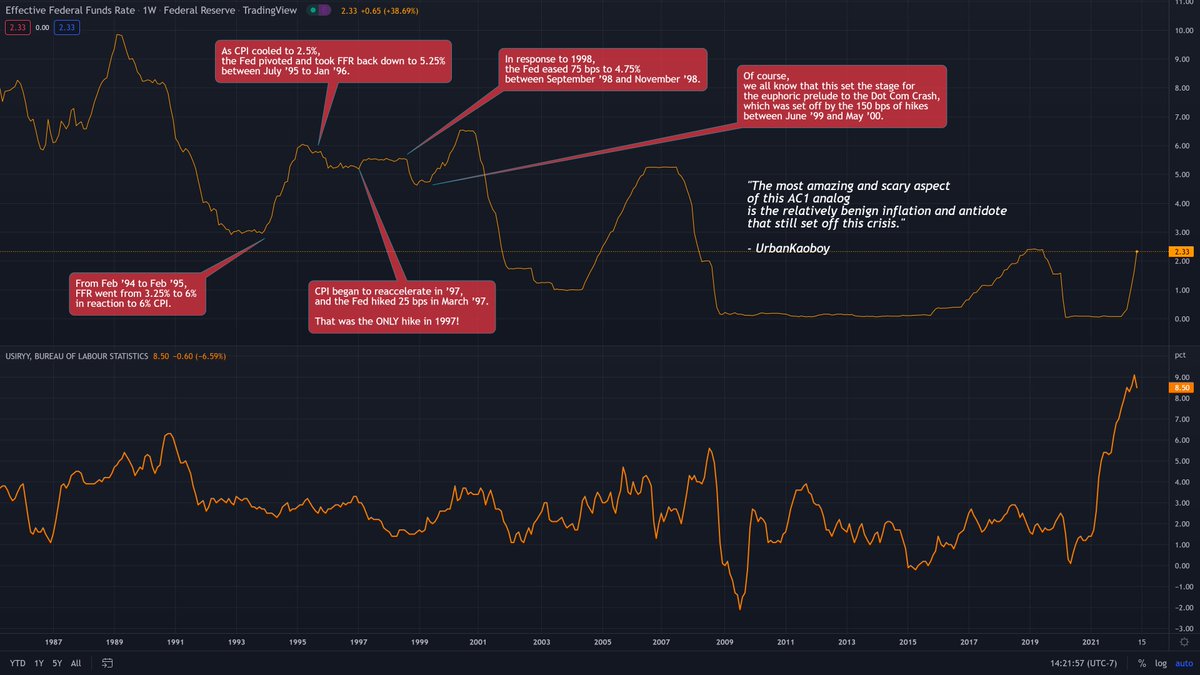
Subscribing to some of the common finance news sites will cost $100 per month. Image