Glen Peters Profile picture
Oct 28 10 tweets 4 min read
The latest #EmissionsGap report is out, but don't forget the uncertainty on 2100 temperature estimates.

Current policies lead to a median warming (50%) across the median of post-2030 scenario assumptions of 2.6°C with a range of 1.7°C to 3.0°C.

unep.org/resources/emis…

🧵
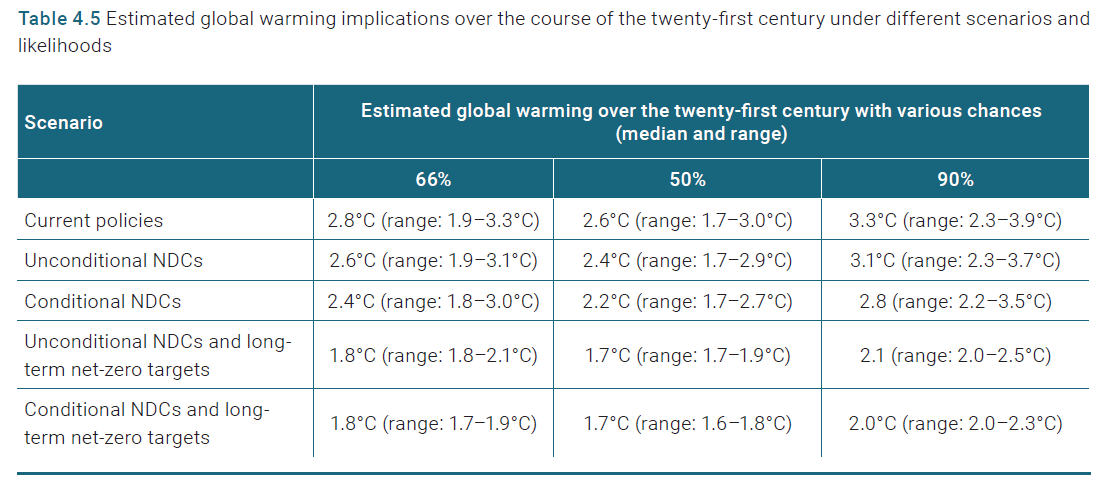
"This range reflects the uncertainty due to extrapolation of GHG emissions after the year 2030 and is given for the central estimate of 2030 emissions implied by current policies, NDCs and/or other pledges." (from EGR2021)

Geophysical uncertainties are on top of this!

2/
"Geophysical uncertainties in the climate response are reflected by the estimates for different warming percentiles (50 per cent, 66 per cent and 90 per cent)." (from EGR2021)

3/
Current Policies:
* Median climate outcome: 2.6°C (range: 1.7–3.0°C)
* 66% climate outcome: 2.8°C (range: 1.9–3.3°C)
* 90% climate outcome: 3.3°C (range: 2.3–3.9°C)

UNEP reports the 66% climate outcomes, which assumes the climate is worse that what scientists expect (50%).

4/
I think this is incredibly confusing.

Journalists will innocently report "...the study finds that with the current policies in place, the world will warm by around 2.8°C this century." @MattMcGrathBBC
bbc.com/news/science-e…

This is the 66% chance, but is worded as if 50%.

5/
The UNEP press release does mention this, unep.org/news-and-stori…, but I think very few would understand the nuance here.

It also makes it confusing, as when people compare IEA (50%) with UNEP (66%), they are not comparing like-with-like.

6/
Moving beyond my hobby horse, the key point is that there is a HUGE range due to scenario uncertainty!

Current Policies (50%): 2.6°C (range: 1.7–3.0°C).

We need to talk about this...

7/
The median scenario outcome (dark blue), presumably, has declining emissions under current policies. Perhaps.

We need to explore this much further:
* What conditions lead to 1.7°C under current policies?
* What conditions lead to 3.0°C under current policies?

8/
My colleague @idasogn led an important paper @ParisReinforce on this issue.

Despite harmonising most things, "emissions are more sensitive to the choice of integrated assessment model than to the assumed mitigation effort"

rdcu.be/cBOBr

9/
Just as we need to shift away from the 1.5°C threshold obsession, we need to shift away from the obsession with very precise estimates of 2100 warming levels that are underpinned by so many assumptions, scenario & climate.

10/10

• • •

Missing some Tweet in this thread? You can try to force a refresh
 

Keep Current with Glen Peters

Glen Peters Profile picture

Stay in touch and get notified when new unrolls are available from this author!

Read all threads

This Thread may be Removed Anytime!

PDF

Twitter may remove this content at anytime! Save it as PDF for later use!

Try unrolling a thread yourself!

how to unroll video
  1. Follow @ThreadReaderApp to mention us!

  2. From a Twitter thread mention us with a keyword "unroll"
@threadreaderapp unroll

Practice here first or read more on our help page!

More from @Peters_Glen

Oct 26
There were some 'dark clouds' at the IPCC 57th session:
* Unusually blunt statements about "management issues" causing delay in the Synthesis Report
* SYR (March 2023) will be based on data from 2019-2020
* AR7 elections now July 2023, making it hard to complete AR7 by 2028
1/
It seems some countries like the delay, the use of old data, & missing the 2028 Global Stocktake.

It will be an immense effort for the new IPCC Bureau to establish (in 2023) & complete the cycle by 2028.

But, these issues take the back seat compared to soup & paintings, etc

2/
Worth having a read of the @IISD_ENB summary:
* "Report of the Ad Hoc Group on Size, Structure and Composition..."
* "Synthesis Report of AR6" (wow!)
* "Transition to the Next Assessment..."
* "A Brief Analysis"
enb.iisd.org/57th-session-i…
3/
Read 4 tweets
Oct 20
Has the global land sink weakened in the last decade?

The sink has high annual variability, and there have been several 5-year periods where the sink has declined or stopped growing.

Maybe the sink has slowed in the last 10 years, maybe it is just variability...

1/
A similar picture with the global ocean sink, though, with less variability.

Is the last five years the start of a new trend, or just expected variability?

2/
Total CO₂ emissions (fossil plus land-use change) have all grown steadily over decades, with a slight slowdown in the last decade due to a slight slowdown in growth of fossil CO₂ emissions offset by a slight decline in land-use CO₂ emissions.

3/
Read 7 tweets
Oct 19
The story that we necessarily have to choose between what is good for the economy & what is good for the climate is an old story that has been accepted uncritically for far too long.

@idasogn in @Morgenbladet, Norwegian & paywall, but a short English🧵1/

morgenbladet.no/ideer/kommenta…
Climate policy leads to a lower GDP in most models:
1. Models ignore the negative effects of climate change
2. Models assume the economy functions optimally without climate measures

It is often an accepted truth that climate policy costs, but that may be completely wrong.

2/
It is very difficult to calculate the economic consequences of climate change, so many researchers prefer to ignore them.

The result is that business as usual scenarios without climate measures look better for the economy than they really are. 🤪

3/
Read 5 tweets
Oct 17
What land areas are considered in the EU+UK emission inventory?

Most (all?) land is considered in the inventory, & visually, it looks like minor changes between different land categories.

But what happens if you look at the annual changes?

1/
When look at annual changes, the picture is quite different:
* Settlements increased
* Forest increased
* Unmanaged wetlands decreased.

2/
This is a similar case in many countries. Here is Norway, settlements increased at the expense of wetlands and grasslands.

Yes, this all leads to emissions...

3/
Read 5 tweets
Oct 10
How does the EU use its bioenergy (in CO₂ emissions)?
* Residential heating: large stable share
* Electricity / heat generation behind most of the growth
* Transport growing, but quite small share
* Pulp & paper stable

This various a lot by country.

1/
Sweden & Finland have large pulp and paper industries, large share of residential heating, plus a lot of combined heat & power.

2/
Norway had a large pulp & paper industry, which has since collapsed. Residential heating remains high in Norway, in addition to strong growth in transport fuels (mainly imported).

3/
Read 7 tweets
Oct 7
Norway harvests 10-15 million m³ each year. But, what is that harvest used for?

Here I try to reconstructed:
* About half goes into harvested wood products (HWPs)
* Paper & products have collapsed
* Roundwood exports are a new thing
* About 1/3 available for energy

1/
There are large trade flows:
* Most paper & paperboard is exported
* Not sure of the background on the sudden increase in roundwood exports?
* Not sure why the roundwood exports were so high ~2000s (I have other questions on this, for another day)

2/
Give or take, the difference between "available for energy" and what Norway reports as energy (UNFCCC) is similar, noting that only about 2/3 of bioenergy is potentially forest product (1/3 is imported transport fuels).

3/
Read 5 tweets

Did Thread Reader help you today?

Support us! We are indie developers!


This site is made by just two indie developers on a laptop doing marketing, support and development! Read more about the story.

Become a Premium Member ($3/month or $30/year) and get exclusive features!

Become Premium

Don't want to be a Premium member but still want to support us?

Make a small donation by buying us coffee ($5) or help with server cost ($10)

Donate via Paypal

Or Donate anonymously using crypto!

Ethereum

0xfe58350B80634f60Fa6Dc149a72b4DFbc17D341E copy

Bitcoin

3ATGMxNzCUFzxpMCHL5sWSt4DVtS8UqXpi copy

Thank you for your support!

Follow Us on Twitter!

:(