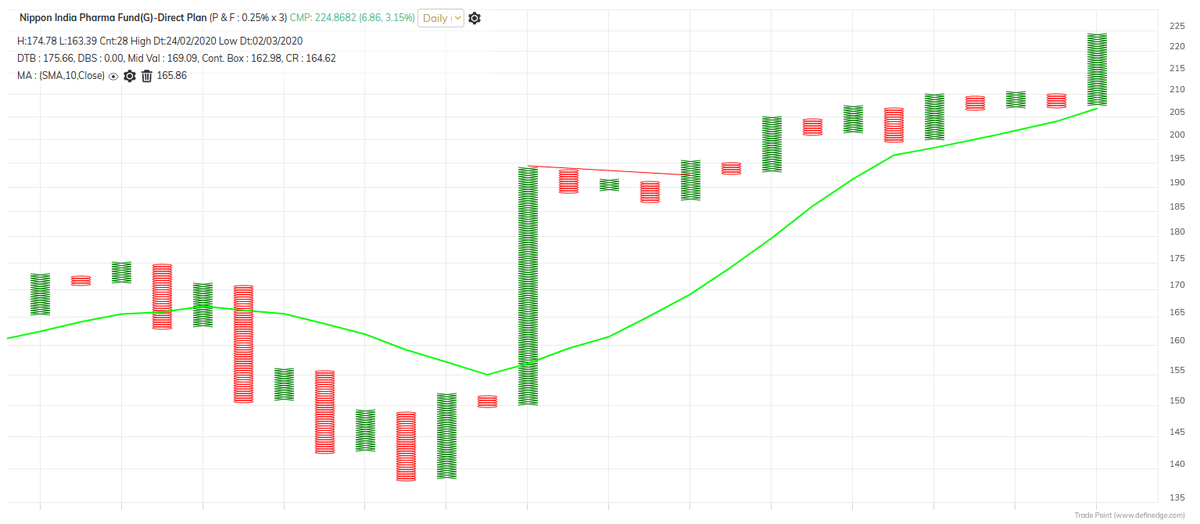
a simple way of trading straddles, and it also tells if mkt is trending or sideways
#PriceAction
#PriceAction
https://twitter.com/Definedge/status/1585988836592873472
Forgot to mention - these straddle charts are now part of the free version of TradePoint in Definedge Securities, u can get free access by just opening an account
you can plot Straddle 'Line' charts in Opstra also
1. Open Interest ===Straddles
OR
2. Options - Strategy charts
1. Open Interest ===Straddles
OR
2. Options - Strategy charts
got some queries abt using Renko charts:
This is an example of Nov 17700 straddle on Renko; in the example given in the video, this could have been initiated instead of the Oct 17700 straddle
This is an example of Nov 17700 straddle on Renko; in the example given in the video, this could have been initiated instead of the Oct 17700 straddle

If this 18100 straddle now gives a double bottom sell below 538 and if it also breaks 520, what is likely to happen to Nifty 

Poll on previous tweet
• • •
Missing some Tweet in this thread? You can try to
force a refresh


