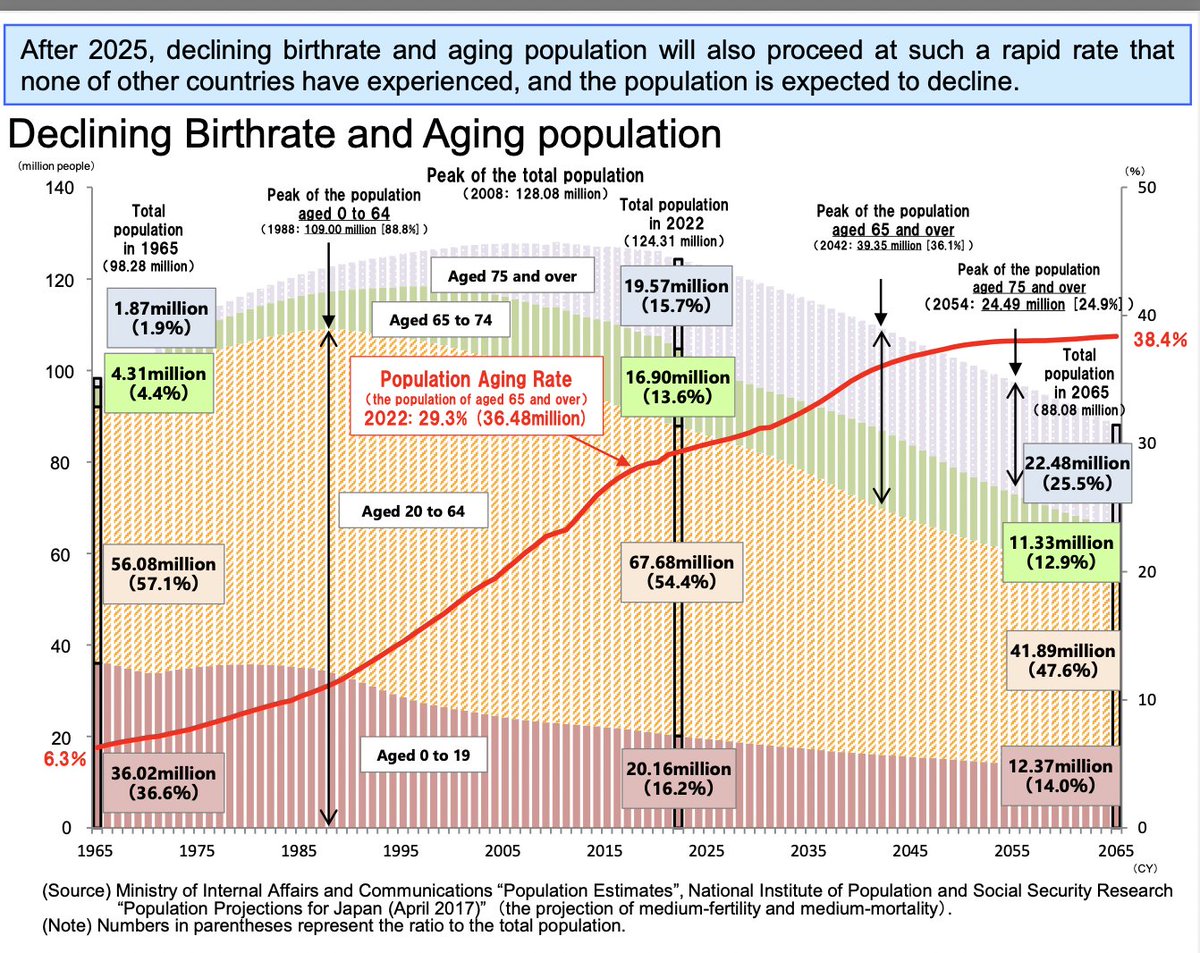
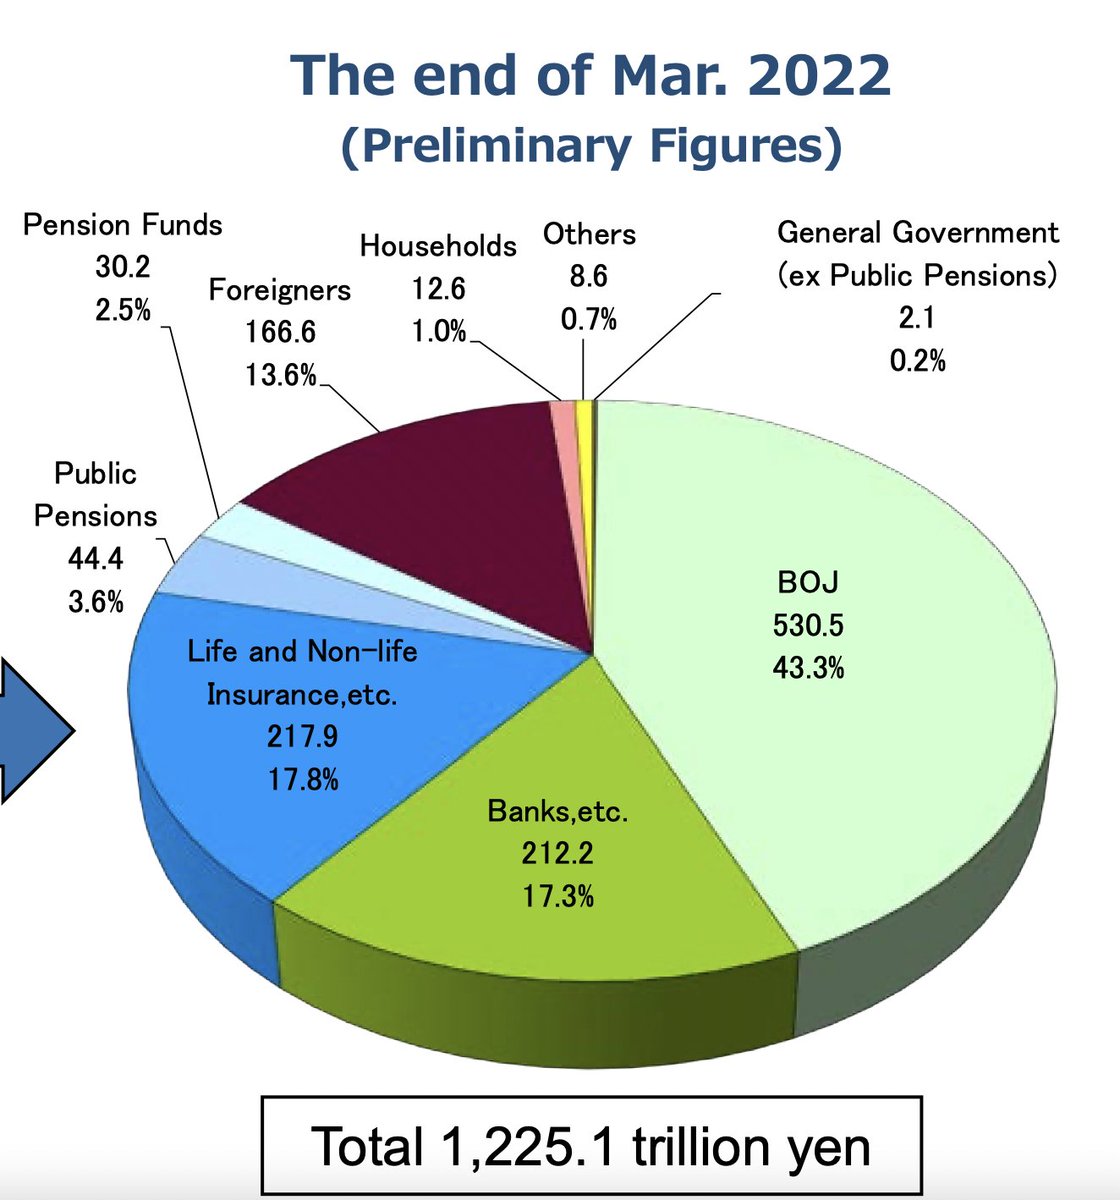
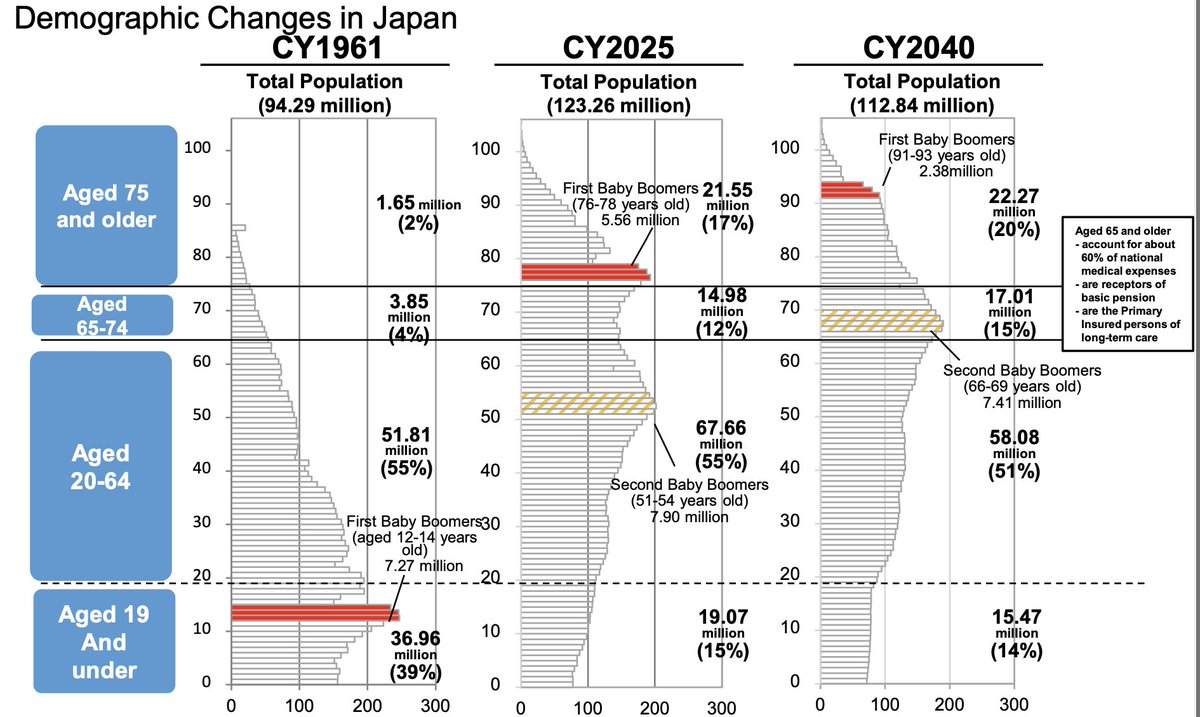
1/24. Is Japan in a debt trap and is that trap now snapping shut? A long thread. We start with the Ministry of Finance's "Japanese Public Finance Fact Sheet' (a must read for everyone).
mof.go.jp/english/policy…
mof.go.jp/english/policy…

2/24. From this, one of the most scary charts in the economic world. Japan has run chronic budget deficits for years, with the result that its accumulated debt level has soared. 

3/24. Total government debt-to-GDP has risen from 59% in 1990 (when Japan's bubble popped) to 220% today. How could this be sustainable? 

4/24. Because as interest rates came down, debt-service payments fell. But if you keep adding debt, and interest rates can't fall any more, your debt-service burden at some stage rises. From the chart below, Japan appears to have hit that point. 

5/24. Japan's total debt keeps rising because one third of expenditure is financed by bond issuance. 

6/24. Surprisingly, Japan actually has quite a "small government" compared with other advanced economies. Further, expenditures are totally dominated by social security: 

7/24. But if you have such a huge gap between revenues and expenditures (as is the case in Japan), then you will run large government's primary deficits as a % of GDP despite the small state: 

8/24. And every time Japan hits an economic head wind, it enacts a fiscal stimulus package financed by bonds. This past week, here we go again:
japantimes.co.jp/news/2022/10/2…
japantimes.co.jp/news/2022/10/2…
9/24. If you study economic growth accounting, identities below are seared into your brain. Japan has generally kept 'r' (nominal interest rate) < 'g' (nominal growth rate) in most yrs due to BOJ's QE, but the debt-to-GDP ratio still rose on back of large primary deficits. 

10/24. If 'r' should ever get above 'g', game over for Japan: it's debt-GDP ratio will explode out of control on rocketing debt-service payments. How could that happen? Either 'r' rises or 'g' falls. Unfortunately, Japan's horrendous demographic outlook means that 'g' will fall. 

11/24. Near term, however, Japan's Achilles' heel is "r". Japan currently exists in an interest rate regime of financial repression; that is, "r" is set by the Bank of Japan. Zero at the overnight policy rate and 0.25% for the 10-year bond.
12/24. Note that longer-term bonds have a lot higher interest rate, as the BoJ does not (yet) target them:
mof.go.jp/english/policy…
mof.go.jp/english/policy…

14/24. Why are financial institutions so happy to accept such low yields? Because inflation has been non-existent in Japan since the 1980s: 

15/24. How could equilibrium be upset? First, inflation could pick up & exceed the 10-yield govt bond yield of 0.25% & LT bond yields of 0.8%. It is doing just that, with the Sep number at 3.0% y/y (excluding fresh food 1.8%) from around zero last year.
e-stat.go.jp/en/stat-search…
e-stat.go.jp/en/stat-search…
16/24. The authorities, however, could respond to inflation fears in 2 ways: could direct insurance cos and pension funds to buy bonds anyway (Japan has history of directed finance). Or, the BOJ just buys every bond that comes up for sale.
17/24. Even if insurance cos & pension funds can't sell, there is a limit to how many extra bonds they can buy for asset-liability matching reasons. So the BOJ is the ultimate buyer. Is this sustainable? Let's follow the money.
18/24. When the BOJ buys a bond from the government, the government gets a matching deposit with its account at the BOJ. It can then go out into the market place and buy goods and services from corporates for its social security & other needs.
19/24. These firms deposit a portion of proceeds from selling their goods & services in their bank accounts or pay their workers, who deposit a portion in their accounts. These accounts pay zero, but who cares when inflation is zero? They are safe and highly liquid deposits.
20/24. Let's jump to Japan's Statistical Yearbook to see how quickly corporate & household bank deposits have built up.
stat.go.jp/english/data/n…
stat.go.jp/english/data/n…
21/24. From the "Financial Assets & Liabilities" page of the "Flow of Funds", corporate bank deposits have gone from Y202 trillion in FY 09 to Y293 trillion in FY 19 (latest year), +45%, & households from Y798 trillion to Y1,000 trillion between FY09 & FY19,+25%.
22/24. Over same period, Japanese nominal GDP has gone from Y529 trillion to Y558 trillion, + 5.5%. So build-up of bank deposits on corporate/household balance sheets has significantly exceeded nominal GDP growth, but UNTIL NOW we have had no inflation & no flight out of the yen. 

23/24. This was a reasonably stable equilibrium since firms and households had no incentive to spend these deposits as long as there was a) no inflation and/or b) a stable yen. Both of these conditions have been breached, so the incentive now exists to get out of these deposits.
24/24. The BOJ then has 2 choices: raise interest rates, which puts government into a debt-service trap, with an accelerating debt-GDP ratio, or bring back capital controls to defend the yen once its FX reserves run dry. What will it do?
• • •
Missing some Tweet in this thread? You can try to
force a refresh


