For anyone who still believes the narrative that this inflation was an accident
Or some kind of "policy error"
Here's a brief reminder about how sovereign debt bubbles work 👇
Or some kind of "policy error"
Here's a brief reminder about how sovereign debt bubbles work 👇
First, a yucky situation:
🚨 Debt/GDP > 100%
🚨 Debt/GDP > 100%

If your economy is capable of growing ~2% per year, and your debt becomes bigger than your GDP
Then you are heading into a runaway death spiral ☠️🌀
*Unless* you can somehow keep the growth rate of your debt below 2%...
Which means bond yields PLUS deficit % below 2%
Then you are heading into a runaway death spiral ☠️🌀
*Unless* you can somehow keep the growth rate of your debt below 2%...
Which means bond yields PLUS deficit % below 2%
Not an easy thing to do
Especially if you like your deficit spending, as most governments do
You are in quite a nasty pickle
Especially if you like your deficit spending, as most governments do
You are in quite a nasty pickle
You have 3 options:
1️⃣ Drastically cut spending + simultaneously raise taxes
And pray to god the resulting surplus can somehow erode the numerator of Debt/GDP...
faster than those austerity measures attack the denominator of Debt/GDP
Not fun, nor good for getting re-elected
1️⃣ Drastically cut spending + simultaneously raise taxes
And pray to god the resulting surplus can somehow erode the numerator of Debt/GDP...
faster than those austerity measures attack the denominator of Debt/GDP
Not fun, nor good for getting re-elected
2️⃣ Go bankrupt
3️⃣ Print sh*tloads of $ anytime there's a crisis, and gradually inflate the debt away over the course of a decade
Hmm.... yeah
We like option #3 😁
Hmm.... yeah
We like option #3 😁
But before you get too far ahead of yourself, you've got to go about option #3 the right way
You can't just start printing money out of nowhere. That might raise some questions
Questions you'd really rather not have to answer
What you need, is a ✨crisis✨
You can't just start printing money out of nowhere. That might raise some questions
Questions you'd really rather not have to answer
What you need, is a ✨crisis✨
Any old crisis should do the trick
War, pandemic, natural disaster, etc. You get my drift
If you're lucky, you can just wait around until a big beautiful crisis lands on your doorstep
If you're unlucky, and no crisis seems to be showing up on its own, you'll have to create one
War, pandemic, natural disaster, etc. You get my drift
If you're lucky, you can just wait around until a big beautiful crisis lands on your doorstep
If you're unlucky, and no crisis seems to be showing up on its own, you'll have to create one
Either way, once you have your crisis, here's the secret:
Big spikes of inflation 🔴
... above prevailing interest rates 🟢
... drive big drawdowns in Debt/GDP 🔵
You can use the 1940s & 50s as a textbook example 👇
Big spikes of inflation 🔴
... above prevailing interest rates 🟢
... drive big drawdowns in Debt/GDP 🔵
You can use the 1940s & 50s as a textbook example 👇
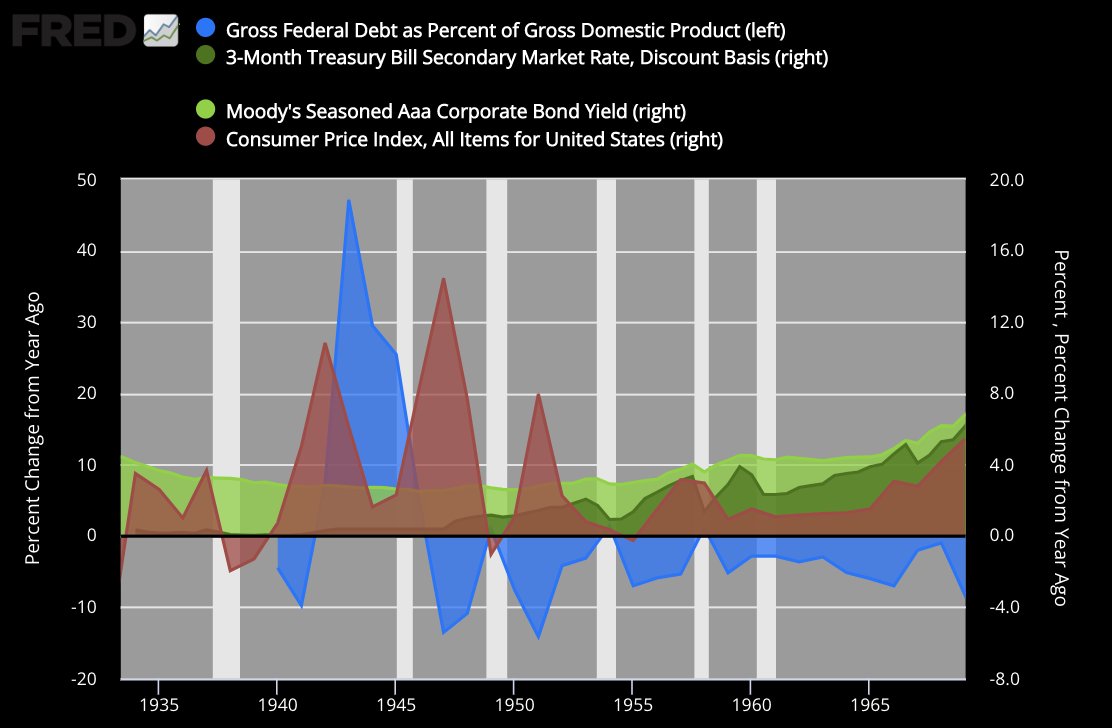
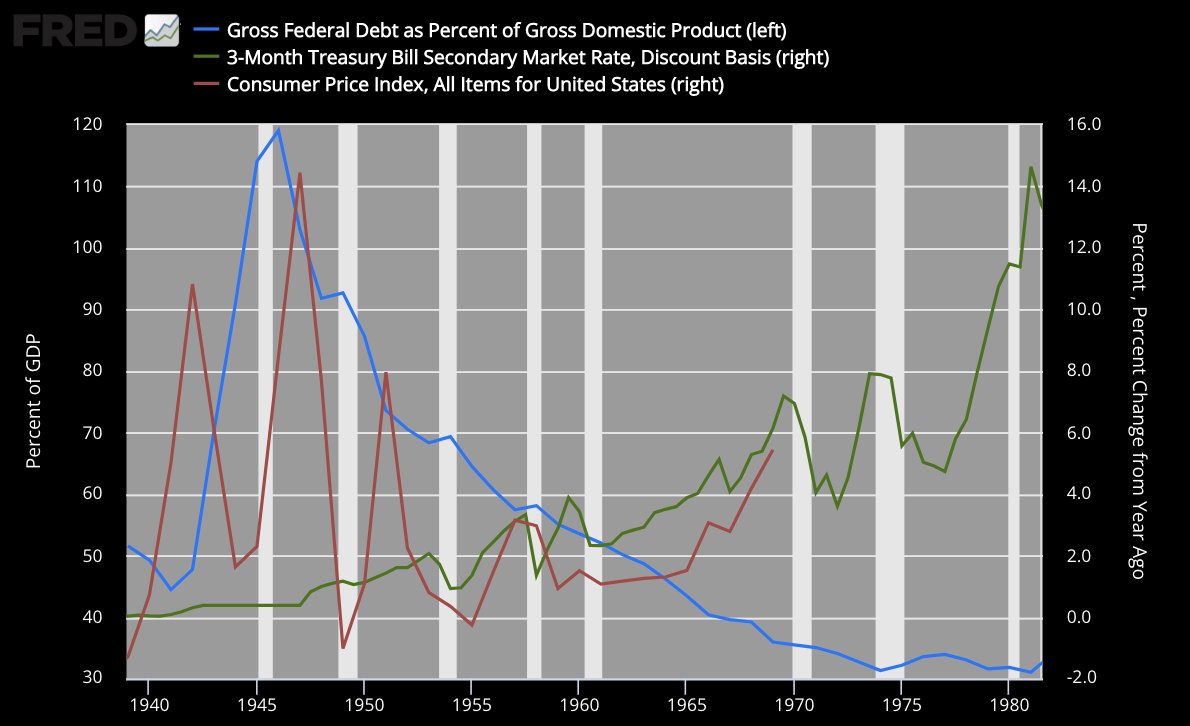
Coming out of WWII, we found ourselves in a similarly nasty debt-pickle, with ~120% debt/GDP
But we ran the playbook, and it worked beautifully
2-3 big spikes of inflation, and debt/GDP quickly came back down to a healthy ~50%
But we ran the playbook, and it worked beautifully
2-3 big spikes of inflation, and debt/GDP quickly came back down to a healthy ~50%
It's remarkably simple
Just generate some inflation, allow it to run hot for a year or two, and then hold bond yields below CPI
Repeat a few times (preferably spaced out inconspicuously over a decade), until Debt/GDP comes back down to target, something manageable like ~50%
Just generate some inflation, allow it to run hot for a year or two, and then hold bond yields below CPI
Repeat a few times (preferably spaced out inconspicuously over a decade), until Debt/GDP comes back down to target, something manageable like ~50%
Voilà 🪄
Your horrifying, potentially empire-toppling, civilization-ending clusterf*ck of a debt bubble miraculously disappears 🥳
Your horrifying, potentially empire-toppling, civilization-ending clusterf*ck of a debt bubble miraculously disappears 🥳
How financial markets work during sovereign debt bubble unwinds
Why liquidity becomes the #1 driver
And how to set yourself up to benefit from it:
Why liquidity becomes the #1 driver
And how to set yourself up to benefit from it:
https://twitter.com/maxjanderson/status/1546472693234470912
• • •
Missing some Tweet in this thread? You can try to
force a refresh