I have seen that PE ratio remains a complex subject for a lot of retail investors,
Lets simplify it the SOIC way!
7 Things about PE that no one will tell you about:-
Retweet to educate maximum investors :)
🧵🧵🧵🧵
Lets simplify it the SOIC way!
7 Things about PE that no one will tell you about:-
Retweet to educate maximum investors :)
🧵🧵🧵🧵
1. What is the meaning of PE ratio?
PE Ratio is simply calculated as Price upon earning. Which denotes how much price are you willing to pay for 1 Rs of Earning of an asset.
👇👇
PE Ratio is simply calculated as Price upon earning. Which denotes how much price are you willing to pay for 1 Rs of Earning of an asset.
👇👇

Let’s take an example:-
For instance:-
There is a commercial Real estate in Delhi worth Rs 100 and it yields 4%. Basically, Rs 4 of earnings.
Its PE will be= 100/4= 25 times
For instance:-
There is a commercial Real estate in Delhi worth Rs 100 and it yields 4%. Basically, Rs 4 of earnings.
Its PE will be= 100/4= 25 times
There is the option of Putting money in Bank FD at 7% rate of interest.
Let’s calculate PE of the BANK FD.
By investing Rs 100 you are making Rs7 of earnings.
Thus, PE=
100/7= 14.3 Times
Let’s calculate PE of the BANK FD.
By investing Rs 100 you are making Rs7 of earnings.
Thus, PE=
100/7= 14.3 Times
Commercial Property vs Bank FD
For 1 Rs of earnings you are paying 25times in Real estate and 14.3times in FD. Thus, making Bank FD a superior option vs Commercial Real Estate.
For 1 Rs of earnings you are paying 25times in Real estate and 14.3times in FD. Thus, making Bank FD a superior option vs Commercial Real Estate.

2. How is PE ratio calculated for Companies?
PE Ratio for businesses can be simply calculated in two ways:-
1. Market Cap/Net Profit
Take the example of KEI Industries.
Market Cap of KEI= 14,408
Profit After Tax of KEI on TTM Basis= 428 crores
PE Ratio=14,408/428cr=34times
PE Ratio for businesses can be simply calculated in two ways:-
1. Market Cap/Net Profit
Take the example of KEI Industries.
Market Cap of KEI= 14,408
Profit After Tax of KEI on TTM Basis= 428 crores
PE Ratio=14,408/428cr=34times
Second way is to Calculate it simply by
Dividing Stock Price by the Earnings per share
KEI’s case= 1600/47.47= 34 times
Dividing Stock Price by the Earnings per share
KEI’s case= 1600/47.47= 34 times

Let’s go to the third most important concept
Difference between
Trailing Twelve Month Pe vs Forward Pe!
Difference between
Trailing Twelve Month Pe vs Forward Pe!
When it comes to the TTM concept:
Simply understand this, that in a year there are 4 Q’s:-
Trailing Twelve Month PE=
Market Cap/EPS of last 4 Quarters
Like currently we are in Q2FY23, EPS of Q2FY23+Q1FY23+Q4FY22+Q3FY22 will be used while calculating the PE ratio.
Simply understand this, that in a year there are 4 Q’s:-
Trailing Twelve Month PE=
Market Cap/EPS of last 4 Quarters
Like currently we are in Q2FY23, EPS of Q2FY23+Q1FY23+Q4FY22+Q3FY22 will be used while calculating the PE ratio.

**Do not miss this**
I am leaving you with a little homework here:- Suppose if Q1FY23 had Ended, and you had the PAT & EPS of Q1FY23. Which all past Quarters will be used to calculate the Trailing twelve month PE? (Answer below!!)
I am leaving you with a little homework here:- Suppose if Q1FY23 had Ended, and you had the PAT & EPS of Q1FY23. Which all past Quarters will be used to calculate the Trailing twelve month PE? (Answer below!!)
Forward PE=
Forward PE is simply a concept where one’s estimate of Forward Earnings can be used to Calculate PE ratio.
This is the estimate of future PAT or Future EPS. Remember one can go wrong, but its important to have an idea.
Forward PE is simply a concept where one’s estimate of Forward Earnings can be used to Calculate PE ratio.
This is the estimate of future PAT or Future EPS. Remember one can go wrong, but its important to have an idea.
Example over here:-
This chemical company on a TTM basis has a PE of 80 times. On a FY24 expected basis the PE is at 44 times, thinking that the future Earnings will come.
(We will read how forward PE can be important or can fool you in different situations)
This chemical company on a TTM basis has a PE of 80 times. On a FY24 expected basis the PE is at 44 times, thinking that the future Earnings will come.
(We will read how forward PE can be important or can fool you in different situations)

4. Why can PE be misleading in fast growing companies?
In Fast growing companies, TTM PE might look artificially high as Earnings are expected to grow at a very fast pace.
In Fast growing companies, TTM PE might look artificially high as Earnings are expected to grow at a very fast pace.
For example:-
This chemical company did capex of nearly 1400 crores+ to set up a Phenol plant in 2018, which was nearly double the size of its entire Balance sheet.
Before capex was commercialized, PE for for this chemical was at 81 times!!
This chemical company did capex of nearly 1400 crores+ to set up a Phenol plant in 2018, which was nearly double the size of its entire Balance sheet.
Before capex was commercialized, PE for for this chemical was at 81 times!!
When Capex started and earnings started growing the PE from 81 times fell to 11 times as the Earnings grew rapidly.
Net Profits went from 79 crores in 2018 to 1000+ crores in 2022.
Net Profits went from 79 crores in 2018 to 1000+ crores in 2022.

Therefore, future is what matters and always anchor yourself to future multiples. Past is past. Money is always made on future earnings vs past.
Understanding fundamentals becomes very important to understand where EPS is headed for the company.
Understanding fundamentals becomes very important to understand where EPS is headed for the company.
5. PE can be Misleading in a lot of companies!
What happens when Earnings of a company are structurally challenged or going through a slowdown for multiple years?
Even a cheap PE or a low can be misleading! As Future EPS keeps falling
What happens when Earnings of a company are structurally challenged or going through a slowdown for multiple years?
Even a cheap PE or a low can be misleading! As Future EPS keeps falling
This is a newspaper stock that had a PE of 10 times in 2019, looks cheap right?
The world changed! Circulation revenues declined and PAT fell from 100 crores to 45 crores!
The world changed! Circulation revenues declined and PAT fell from 100 crores to 45 crores!

PE remained constant at 8-10 times, yet the stock is down by 55% from there as Earnings degrew.
Thus, PE as a metric won’t capture business quality. That has to be captured by you as an investor.
Thus, PE as a metric won’t capture business quality. That has to be captured by you as an investor.
6. PE and the twin engines of stock returns
A Stock price= PE Ratio*Earnings Per share
A stock can re-rate due to multiple reasons. Some of them are mentioned here:-
A Stock price= PE Ratio*Earnings Per share
A stock can re-rate due to multiple reasons. Some of them are mentioned here:-

Suppose,
You buy a company at 10 times Earnings.
Price=Rs.10
EPS=Rs 1
PE=10 times
After 2 years
PE Becomes 20
EPS become=Rs 2
Price=Rs.40
This is what happens when stocks with low expectations or the ones which are under-tracked end up outperforming massively.
You buy a company at 10 times Earnings.
Price=Rs.10
EPS=Rs 1
PE=10 times
After 2 years
PE Becomes 20
EPS become=Rs 2
Price=Rs.40
This is what happens when stocks with low expectations or the ones which are under-tracked end up outperforming massively.

7. If you buy a stock with High PE, EPS growth has to be fast or continue for really long for stock returns to come
Peak PE (out of whack)+ Peak Margins=Lethal combination and very little margin of safety
Peak PE (out of whack)+ Peak Margins=Lethal combination and very little margin of safety
Example:-
Look at this Amines co,
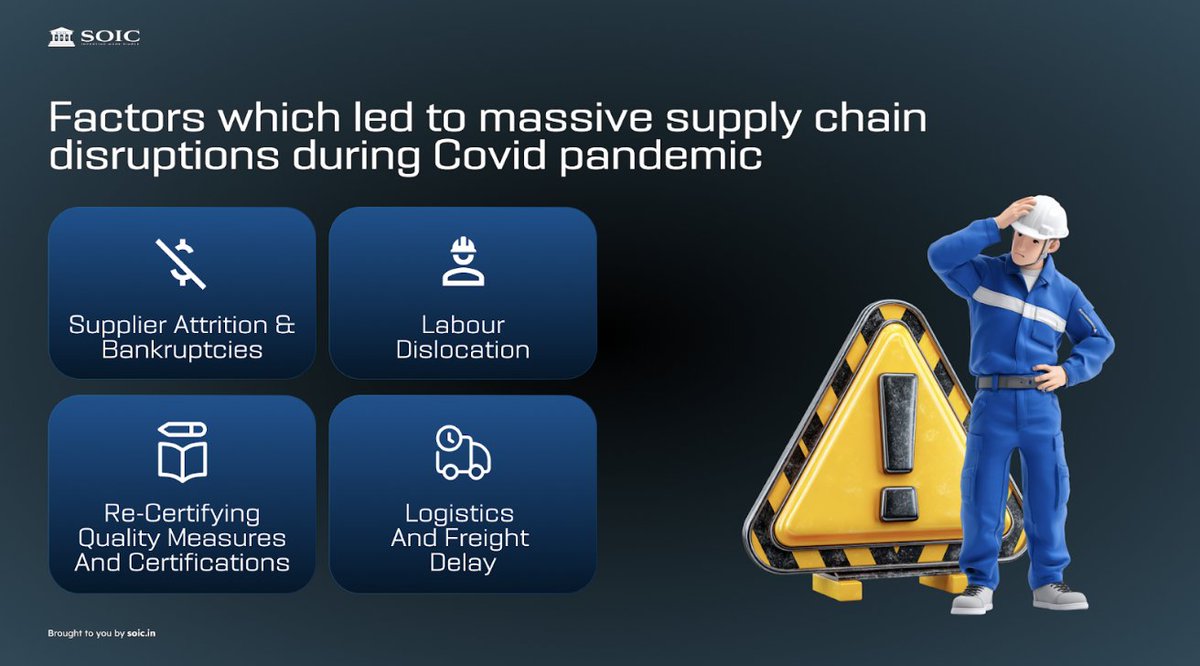
Historically the Margins were in a range of 18-22%. Yet, post covid due to stopping of imports and shortage of the chemicals they make. Pricing of the chemicals they make went up by nearly 50-60%. Thereby, leading to an increase in margins.
Look at this Amines co,
Historically the Margins were in a range of 18-22%. Yet, post covid due to stopping of imports and shortage of the chemicals they make. Pricing of the chemicals they make went up by nearly 50-60%. Thereby, leading to an increase in margins.
Just check the margins:-

And now look at the PE ratio that the company was trading at vs the average PE it used to get.
This is what we call a stock being at Peak PE+Peak Margins=Lethal combination of Zone of Danger
Remember this!!
Zone of danger and Margin of Safety (Marry margins with PE ratios)
This is what we call a stock being at Peak PE+Peak Margins=Lethal combination of Zone of Danger
Remember this!!
Zone of danger and Margin of Safety (Marry margins with PE ratios)

In Conclusion,
PE ratio can also be re-written as Perception to Earnings ratio
Perception teaches us about: Liqudity, flows, flavour, out of flavour and interest rates (index valuations)
Earnings: Business' ability to grow earnings due to various triggers!
PE ratio can also be re-written as Perception to Earnings ratio
Perception teaches us about: Liqudity, flows, flavour, out of flavour and interest rates (index valuations)
Earnings: Business' ability to grow earnings due to various triggers!
Therefore, Technical Analysis is the study of Perception
and Fundamental Analysis is the study of earnings and where the earnings can come from.
Next set of videos will teach you both the concepts on our YouTube channel!
youtube.com/c/SOICfinance
and Fundamental Analysis is the study of earnings and where the earnings can come from.
Next set of videos will teach you both the concepts on our YouTube channel!
youtube.com/c/SOICfinance
Also If you loved the thread,
On coming Sunday we are doing a session on the QSR sector including both Indian and International Companies from
Here is the link to register:- rzp.io/l/8q589nJpm
For SOIC Tribe Members this is a part of the SOIC Membership(inc all webinars)
On coming Sunday we are doing a session on the QSR sector including both Indian and International Companies from
Here is the link to register:- rzp.io/l/8q589nJpm
For SOIC Tribe Members this is a part of the SOIC Membership(inc all webinars)

• • •
Missing some Tweet in this thread? You can try to
force a refresh