In just the last several weeks, we have seen MAJOR layoff announcements from:
-Meta
-Stripe
-Paypal
-Microsoft
-Amazon
Here is an update on the labor market and why these mass layoff announcements will keep coming 👇
1/
-Meta
-Stripe
-Paypal
-Microsoft
-Amazon
Here is an update on the labor market and why these mass layoff announcements will keep coming 👇
1/
This is not just a technology story.
We have also seen layoffs from Redfin and trucking giant C.H. Robinson
freightwaves.com/news/ch-robins…
@FreightAlley
2/
We have also seen layoffs from Redfin and trucking giant C.H. Robinson
freightwaves.com/news/ch-robins…
@FreightAlley
2/
Just a few months ago, the major economic stories were about worker shortages, specifically truckers, and now we are seeing major companies announce sizeable layoffs across all industries, from technology to housing to transportation.
cnbc.com/2022/11/14/ama…
3/
cnbc.com/2022/11/14/ama…
3/
Almost three months ago, I made a video on the jobs market and predicted that the labor market was going to weaken massively in the coming 3-6 months based on my leading indicator of employment and the sequence of the economic cycle.
4/
https://twitter.com/EPBResearch/status/1565412928840503296?s=20&t=rRGCFQjslNgyIHd3MyBGMw
4/
To understand why layoffs are starting now, we have to understand the sequence of the economy.
Employment is a lagging indicator which means it moves very late in the economic cycle.
Sometimes job losses don’t begin until after a recession begins (1974, 1980, etc.)
5/
Employment is a lagging indicator which means it moves very late in the economic cycle.
Sometimes job losses don’t begin until after a recession begins (1974, 1980, etc.)
5/

In both the 1974 & 1980 recessions, the economy was adding jobs for up to 8 months into the recession!
So to get an idea of where employment is going, we need to focus our attention on what are called leading economic indicators.
6/
So to get an idea of where employment is going, we need to focus our attention on what are called leading economic indicators.
6/

When the Federal Reserve makes a big shift in monetary policy, that is the very first signal the economy will change about a year or so later.
It was around September 2021 when it became clear the Fed was going to tighten policy.
Massive rate hikes and QT started in 2022.
7/
It was around September 2021 when it became clear the Fed was going to tighten policy.
Massive rate hikes and QT started in 2022.
7/

Whenever the Federal Reserve tightens monetary policy, the industries of the economy that are most sensitive to interest rates feel this change first.
Right away, in early 2022, we started to see the housing market slow down very rapidly.
8/
Right away, in early 2022, we started to see the housing market slow down very rapidly.
8/
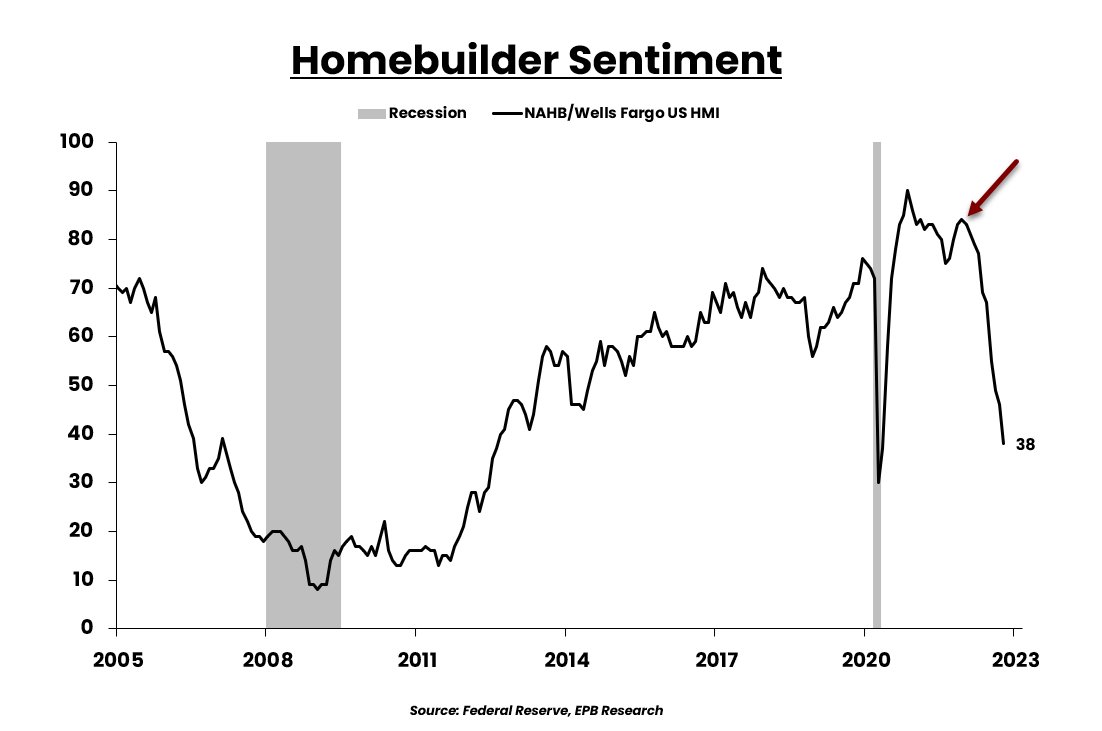
So first, the Federal Reserve raised interest rates, then the housing market slowed down.
If the housing market cools, that usually means the consumption of things associated with home buying will go down.
Think home appliances, furniture, home-building tools, etc.
9/
If the housing market cools, that usually means the consumption of things associated with home buying will go down.
Think home appliances, furniture, home-building tools, etc.
9/

If the housing slowdown spreads into the consumption of big bulky durable goods like home appliances (it has), that puts downward pressure on the transportation sector or the industries that move these goods around the world.
Follow @FreightAlley for trucking data.
10/
Follow @FreightAlley for trucking data.
10/

After the Fed tightens, then the housing market cools, followed by weakness in retail sales of housing-related goods, and then there is confirmation of that downturn by trucking companies, you have a reliable sequence that spells trouble for the broader economy (employment).
11/
11/

We can also reference the deeply inverted yield curve, another leading indicator, to again confirm that monetary restraint is deeply entrenched.
12/
12/

To review:
Fed tightens policy → rates go up → housing market slows → consumption of household goods declines → the volume of goods moving around the economy drops → less demand for transportation → ...
13/
Fed tightens policy → rates go up → housing market slows → consumption of household goods declines → the volume of goods moving around the economy drops → less demand for transportation → ...
13/
So just by studying that sequence, it is not a surprise that now, after these events transpired all throughout late 2021 and 2022 that we are getting announcements of layoffs in late 2022 and likely into 2023.
14/
14/
"But Eric, the labor market is still strong"
Maybe, maybe not.
If we use one metric (nonfarm payrolls) to define the labor market, then yes, no major signs of weakness yet.
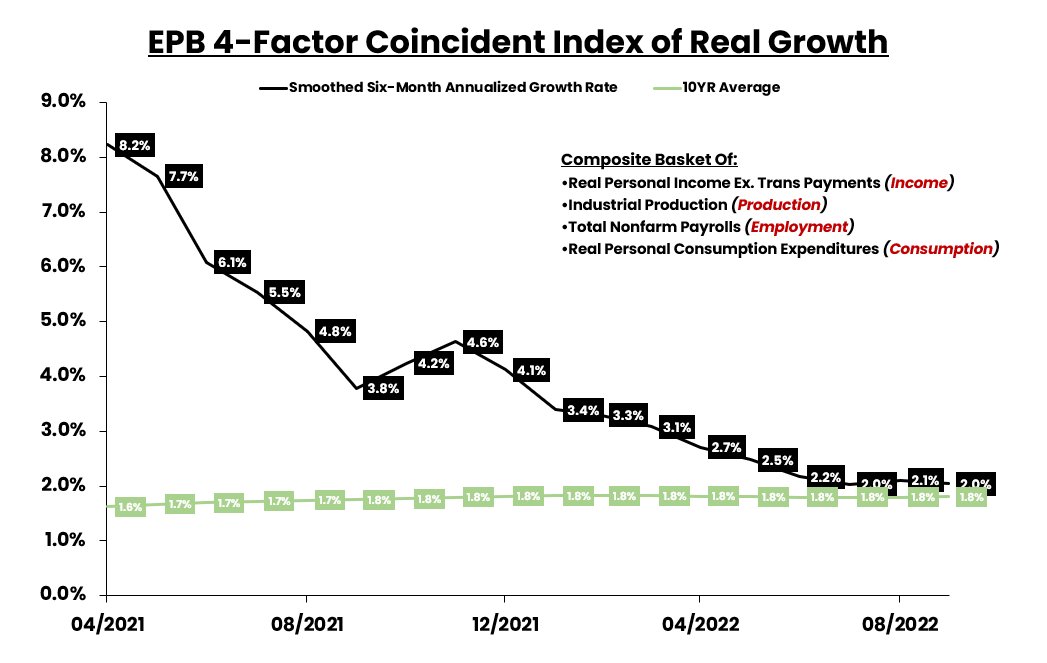
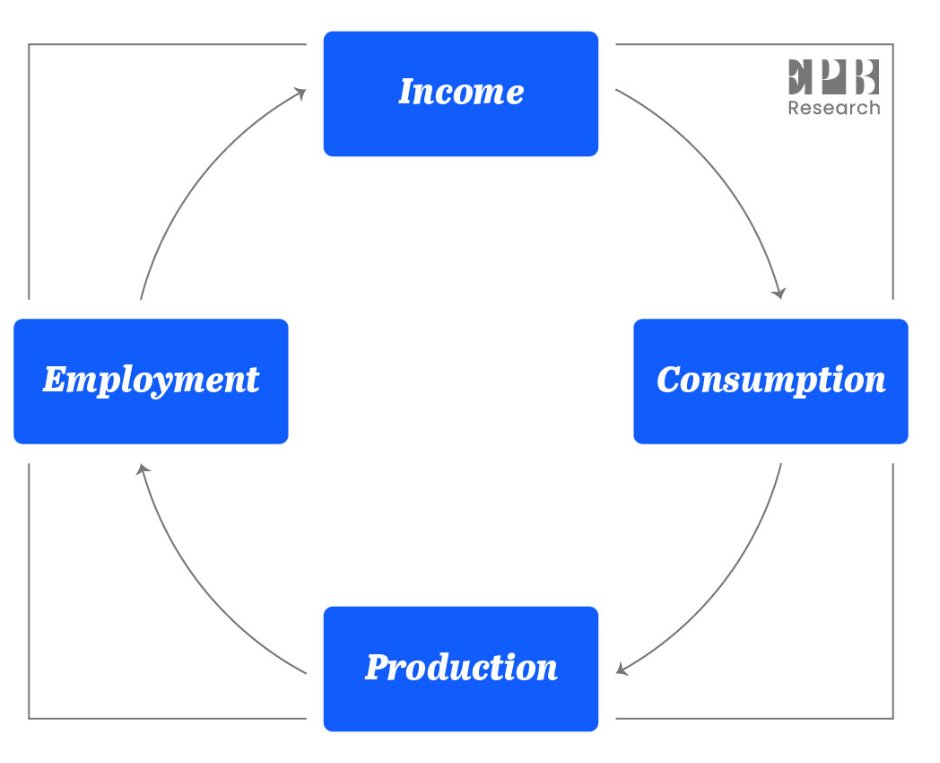
I prefer to use a broader and more complete coincident employment index to make that determination.
15/
Maybe, maybe not.
If we use one metric (nonfarm payrolls) to define the labor market, then yes, no major signs of weakness yet.
I prefer to use a broader and more complete coincident employment index to make that determination.
15/
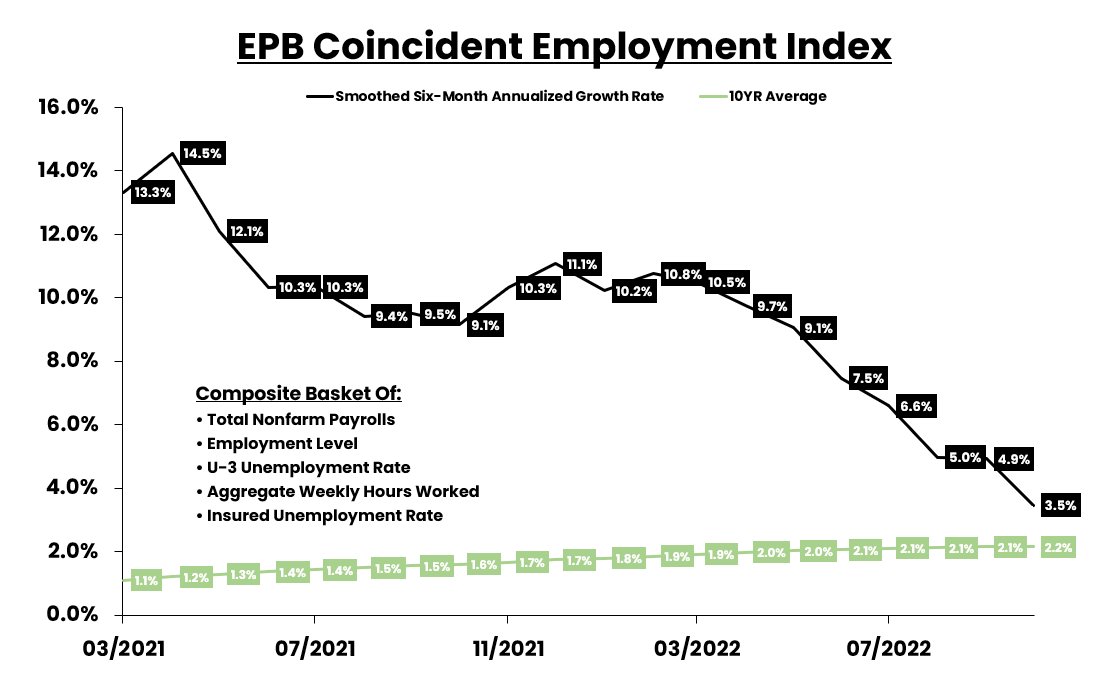
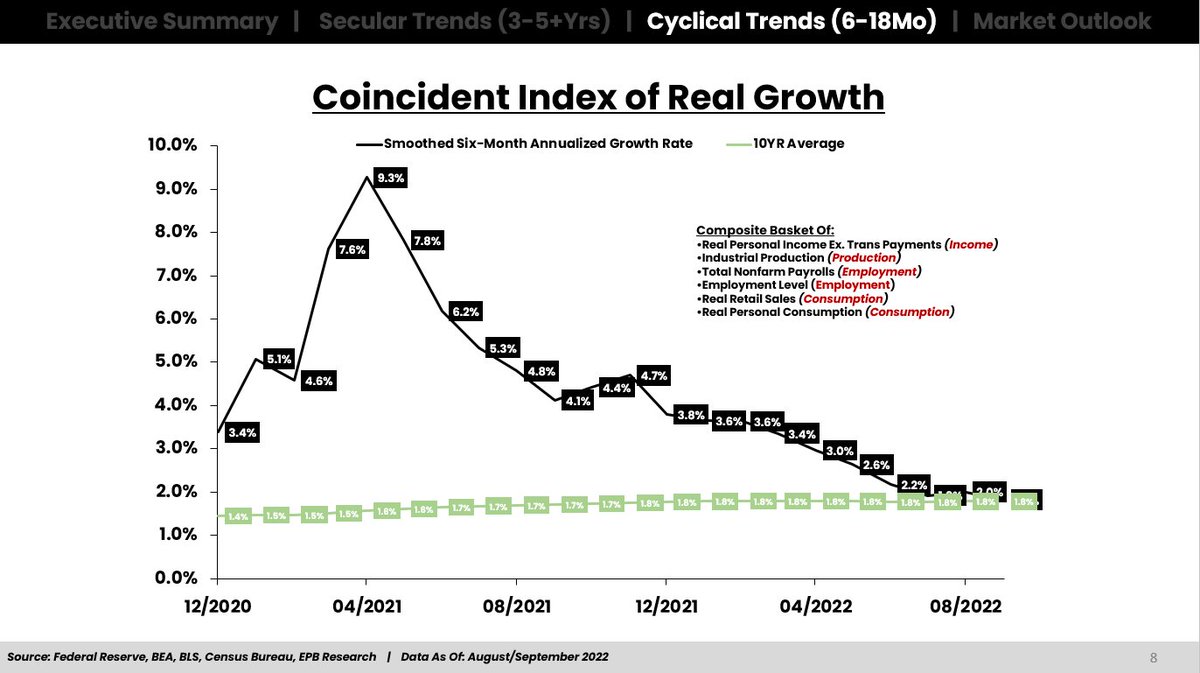
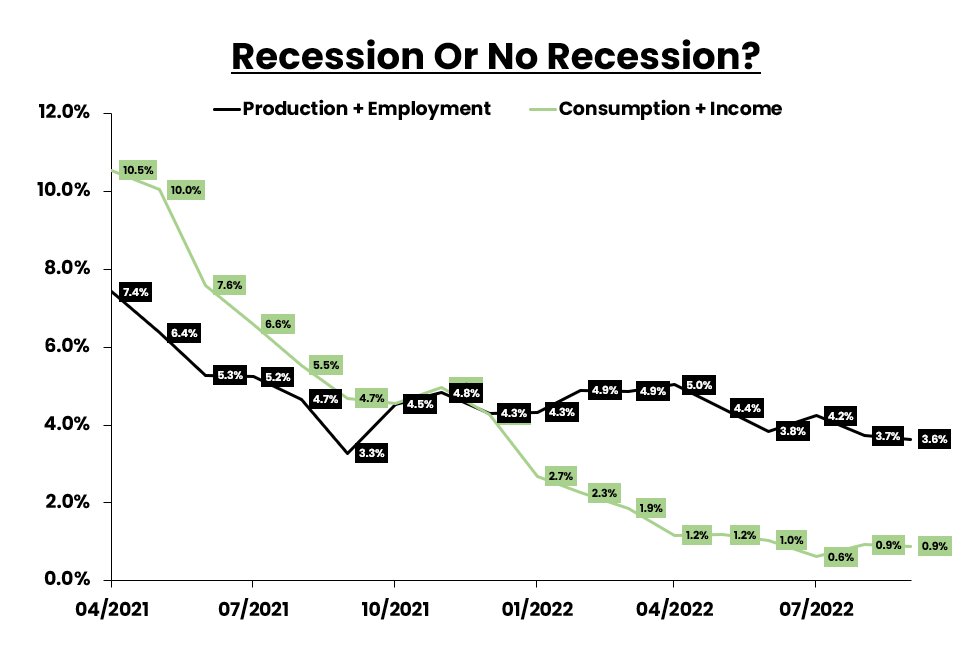
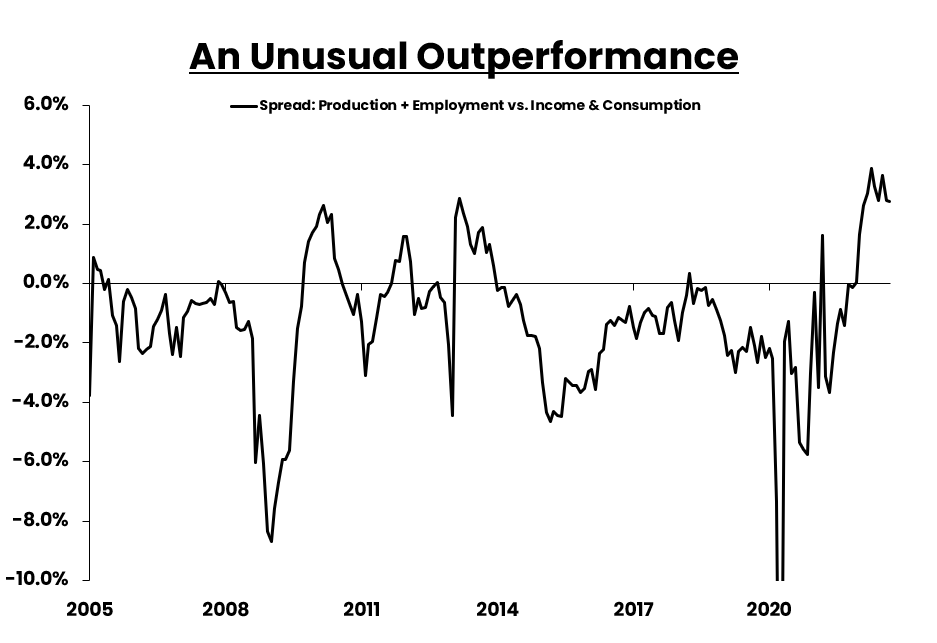
In my last video/thread on jobs, the coincident employment index held a growth rate of +6.6% vs. +3.5% today.
Last Thread:
Mass Layoffs Video:
16/
Last Thread:
https://twitter.com/EPBResearch/status/1565412998956699650?s=20&t=ThVkKLaBfZqR6aZyaSbrcw
Mass Layoffs Video:
16/
Not only does the sequence of economic events outlined above paint a convincing picture of more layoffs to come, but my leading index of employment continues to worsen as well.
In the last update, the growth rate of the leading employment index was +0.4% vs. -0.5% today.
17/
In the last update, the growth rate of the leading employment index was +0.4% vs. -0.5% today.
17/

So layoff announcements have started to pile up.
But based on the sequence of economic events and the clear picture from the leading employment index, it looks like this softening of the labor market is just getting started.
18/
But based on the sequence of economic events and the clear picture from the leading employment index, it looks like this softening of the labor market is just getting started.
18/
I expect the layoff announcements to grow and for the weakness to show up in official labor data over the coming months.
If you found this thread helpful or informative, please share it & throw me a follow: @EPBResearch
I make threads & videos like this every week.
🙏
19/19
If you found this thread helpful or informative, please share it & throw me a follow: @EPBResearch
I make threads & videos like this every week.
🙏
19/19
• • •
Missing some Tweet in this thread? You can try to
force a refresh