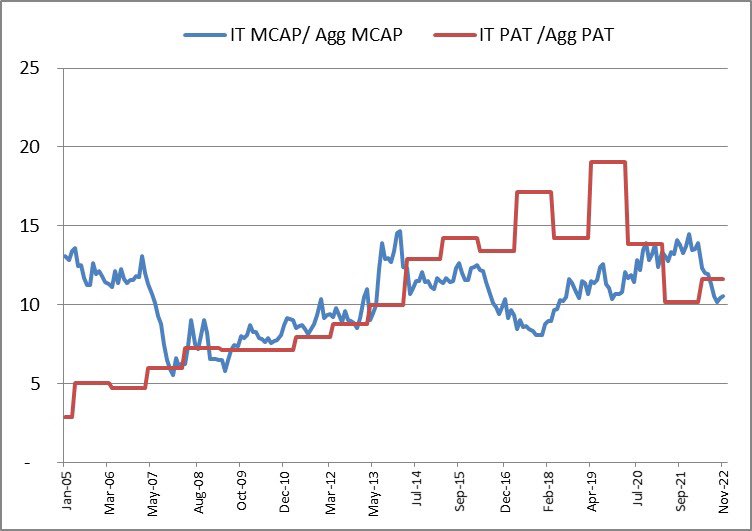
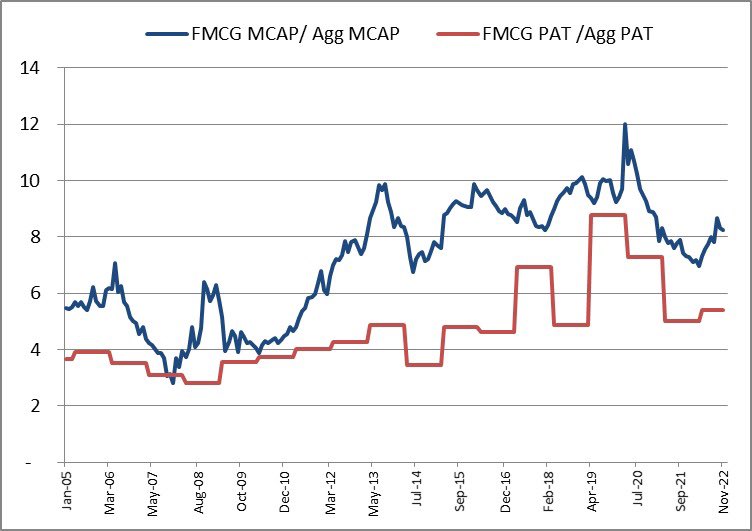
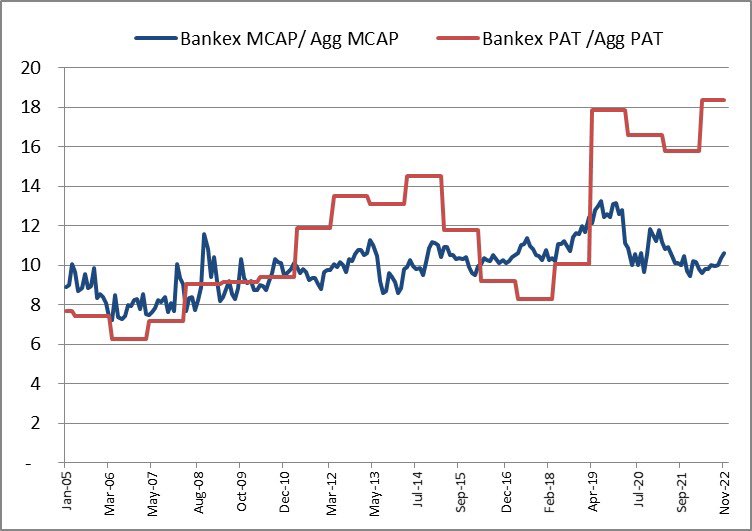
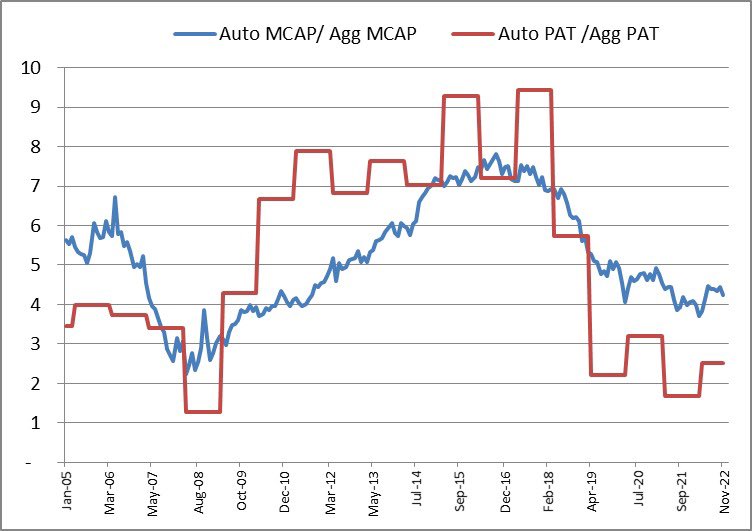
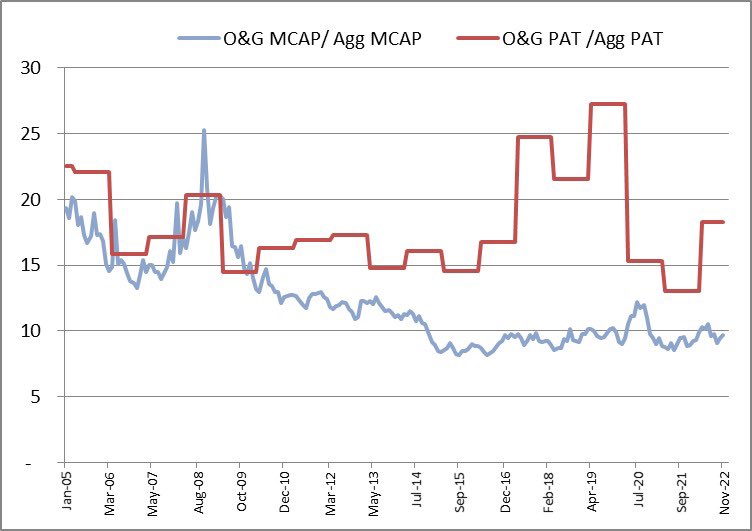
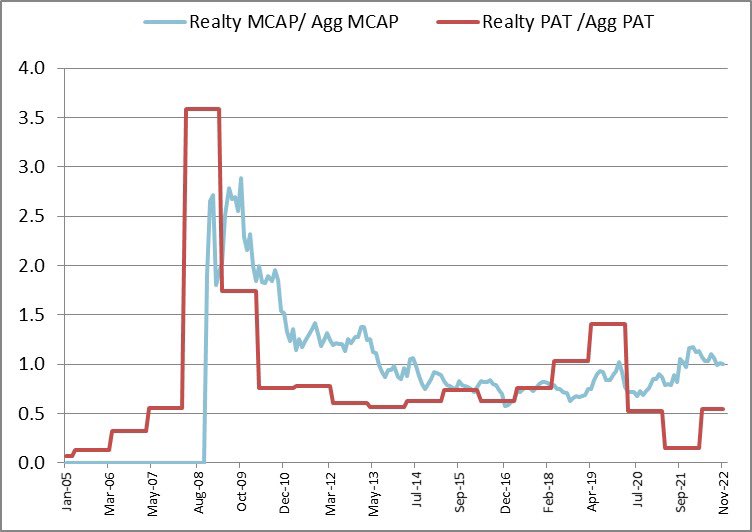
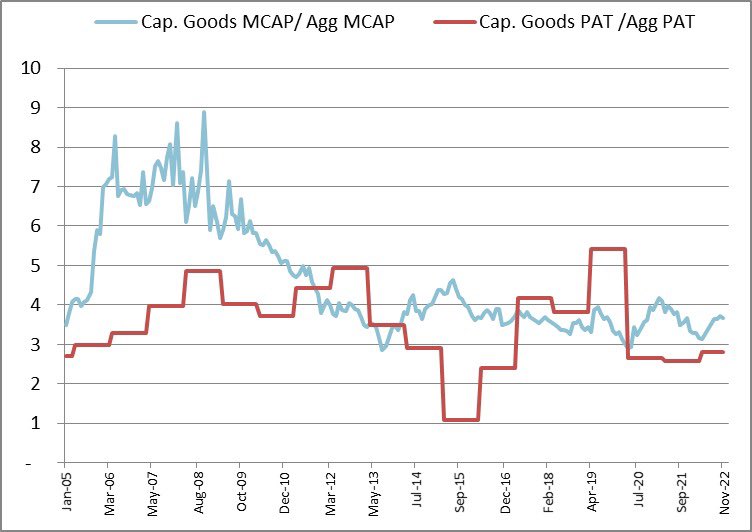
Some charts to help understand where each sector is at in terms of their aggregate profits and aggregate market cap. (1/9)

Starting with metals: does market know something that we don’t?
Healthcare: always bottoms when the line converges. So some more time before bottom?
IT: bottom done? Possible accumulation phase now.
FMCG: Beginning of a new cycle?
Banks: Undervalued?
Auto: (perennial) dark horse?
Oil & Gas: Lull continues
Realty: Nothing different
Cap goods: 2004 to 2007 like baby steps(s)?

• • •

Missing some Tweet in this thread? You can try to force a refresh
 

Keep Current with Balaji Vaidyanath ⚡️

Balaji Vaidyanath ⚡️ Profile picture

Stay in touch and get notified when new unrolls are available from this author!

Read all threads

This Thread may be Removed Anytime!

PDF

Twitter may remove this content at anytime! Save it as PDF for later use!

Try unrolling a thread yourself!

how to unroll video
  1. Follow @ThreadReaderApp to mention us!

  2. From a Twitter thread mention us with a keyword "unroll"
@threadreaderapp unroll

Practice here first or read more on our help page!

More from @nbalajiv

Jun 21
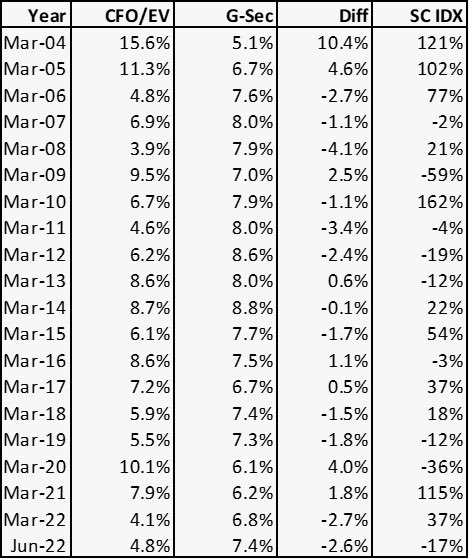
Table of small-cap earnings yield as measured by their cash flow from operations divided by enterprise value and g-sec below. The difference between earnings yields and g sec has been negative for 11 out of 19 observations. (1/9)
9 out of these 11 observations, the small-cap index has returned negative the following financial year. True to this, FY23 so far has been negative 17%. It is unlikely that we see a runaway rally in small-cap index with such a huge negative differential between earnings & gsec
Even if gsec yields were to come down to Mar 2004 levels of 5.1%, we will still have a negative differential with current small-cap earnings yield of 4.8%.
Read 8 tweets
Sep 22, 2021
This is that that year’s top 500 stock constituents by market cap and that that year’s PE. (1/4)
This is that that year’s Nifty constituents and that that year’s PE. (2/4)
This is current crop of BSE-500 constituents and their PE since 2003. (3/4)
Read 5 tweets
Aug 11, 2021
Natural Gas prices are soaring. Logistical issues, delay in capacity expansion due to covid, decline in storage capacity etc are reasons attributed to this. However these are only temporary. Structural reasons differ. (1/4)
Coal plants are being retired. Nuclear continues to demonized. Wind and Solar are unreliable and intermittent. They are like drunkards who need the support of a pole (Natural Gas) to stand. (2/4)
As countries add more drunkards, it increases the demand for poles. And what is worse? Places where sun shines the most and wind blows the strongest (best renewable spots) are already taken. Therefore location advantage becomes marginal. (3/4)
Read 4 tweets
Aug 10, 2021
What India can learn from other countries with respect to sports?
How to nurture talent at early stage.

What other countries (rich and poor alike) can learn from India?
How to not be miserly and reward successful athletes.

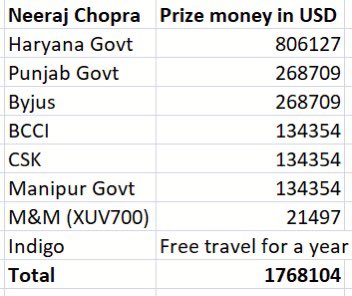
Prize money for gold winners: (1/4)
Prize money for our golden boy: (2/4)
Read 4 tweets
Aug 10, 2021
I make horrible market predictions. Then I look at UN’s climate predictions and seek some solace.

health.economictimes.indiatimes.com/news/industry/…
1972: 10 years for catastrophe Image
1982: Nations will be wiped off the earth by year 2000 Image
Read 8 tweets
Aug 8, 2021
Fintwit believes Chemplast Sanmar delisted at ₹5 and IPOs again at ₹540 thereby making more than 100x. A cursory look at RHP reveals that CSL paid ₹15 per share of ₹1 face value and not ₹5. Current IPO price of ₹540 is ₹5 face value. In essence the delisting price was ₹75
Which means the difference between current IPO price (₹540) and delisted price in 2012 (₹75) is 7.2x and not the 100x it’s made out to be. What has been the performance of some of CSL’s competitors (chemical pack) since May 2012 till date? See the list below: 👇🏼(2/5)
2012 Avatar of CSL did not have a custom manufacturing business. Current avatar houses custom manufacturing business. A segment growing at 35% CAGR. (Source: RHP)

2012 import duty for PVC resins - 5%
2021 import duty for PVC resins - 10% (3/5)
Read 5 tweets

Did Thread Reader help you today?

Support us! We are indie developers!


This site is made by just two indie developers on a laptop doing marketing, support and development! Read more about the story.

Become a Premium Member ($3/month or $30/year) and get exclusive features!

Become Premium

Don't want to be a Premium member but still want to support us?

Make a small donation by buying us coffee ($5) or help with server cost ($10)

Donate via Paypal

Or Donate anonymously using crypto!

Ethereum

0xfe58350B80634f60Fa6Dc149a72b4DFbc17D341E copy

Bitcoin

3ATGMxNzCUFzxpMCHL5sWSt4DVtS8UqXpi copy

Thank you for your support!

Follow Us on Twitter!

:(