Wow: the October personal saving rate was the second lowest ever recorded (data goes back to 1959).
The two-month moving average was actually the lowest ever recorded and the three-month moving average was the third lowest.
The two-month moving average was actually the lowest ever recorded and the three-month moving average was the third lowest.

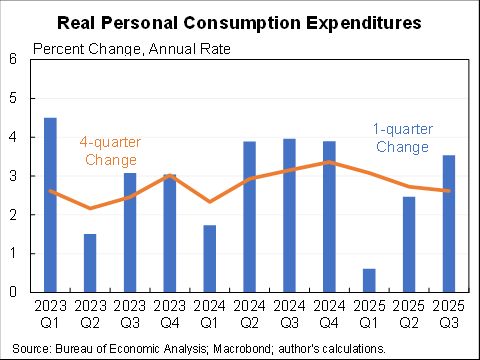
The low and fall saving rate is supporting a huge divergence between stagnant real incomes and steadily rising consumption.
Relative to CBO's pre-pandemic forecast* real per capita:
Disposable personal income: -5%
Personal consumption expenditures: +2.5%
Relative to CBO's pre-pandemic forecast* real per capita:
Disposable personal income: -5%
Personal consumption expenditures: +2.5%

*CBO does not forecast these exact variables but has ones that are close (e.g., personal income instead of disposable personal income). I think my versions of their forecast are reasonably robust--you can see the levels and approximate CBO forecasts here. 


The personal saving rate is typically about 7.5%.
During the pandemic it was above 10% for the 15 straights months--with the entire period accumulating $2.2T in excess savings.
It has been below average for 13 straight months, $800b in excess dissavings.
During the pandemic it was above 10% for the 15 straights months--with the entire period accumulating $2.2T in excess savings.
It has been below average for 13 straight months, $800b in excess dissavings.

You can also think about this as the lagged impact of fiscal policy and pandemic-reduced consumption. The initial fiscal multipliers were relatively low as people saved money. But fiscal policy has long and variable lags and it is supporting consumption (and inflation) now.
This story is likely disproportionately about higher income households (but we can't be sure because BEA does not produce real-time distributional data).
One hint is that real compensation per capita, which matters more for middle-class households, is only slightly below trend.
One hint is that real compensation per capita, which matters more for middle-class households, is only slightly below trend.

Overall this is consistent with the excess saving story (the household budget constraint being expanded) & the pent up demand story (the marginal utility of spending being expanded as the pandemic eased).
Also of fiscal policy mattering--could debate if for better or worse.
Also of fiscal policy mattering--could debate if for better or worse.
Will we have a Wile E Coyote moment when consumers realize there is nothing below them and consumption plummets? Could happen--although these data plus more direct indicators of household balance sheets and financial distress suggest that moment could be 6-12 months away.
• • •
Missing some Tweet in this thread? You can try to
force a refresh


