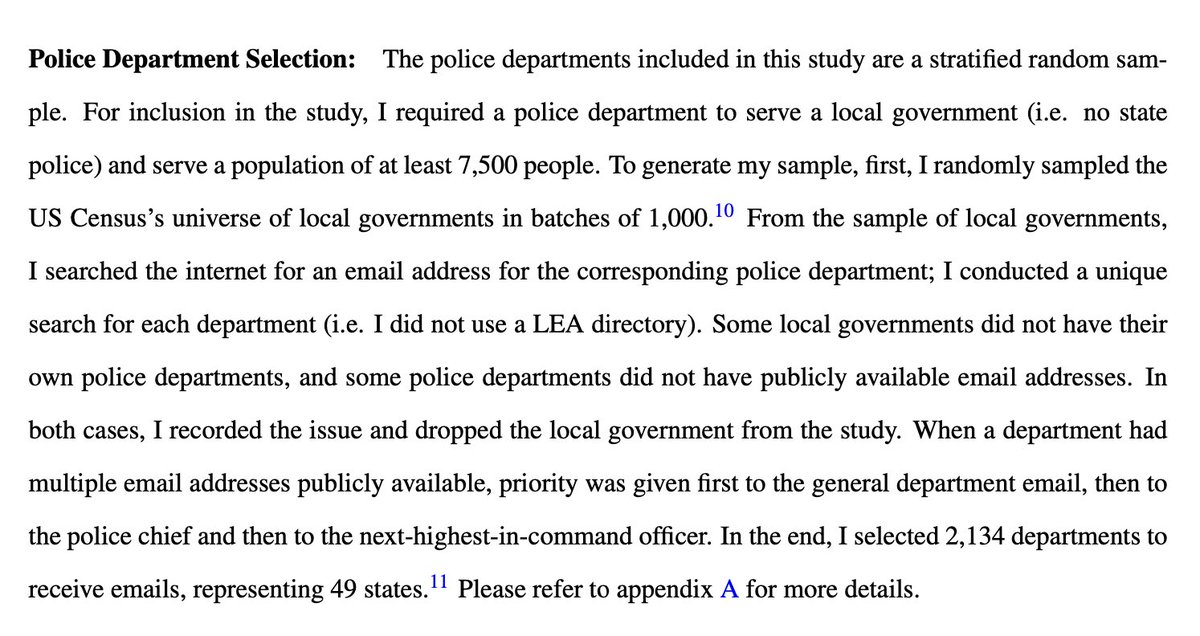
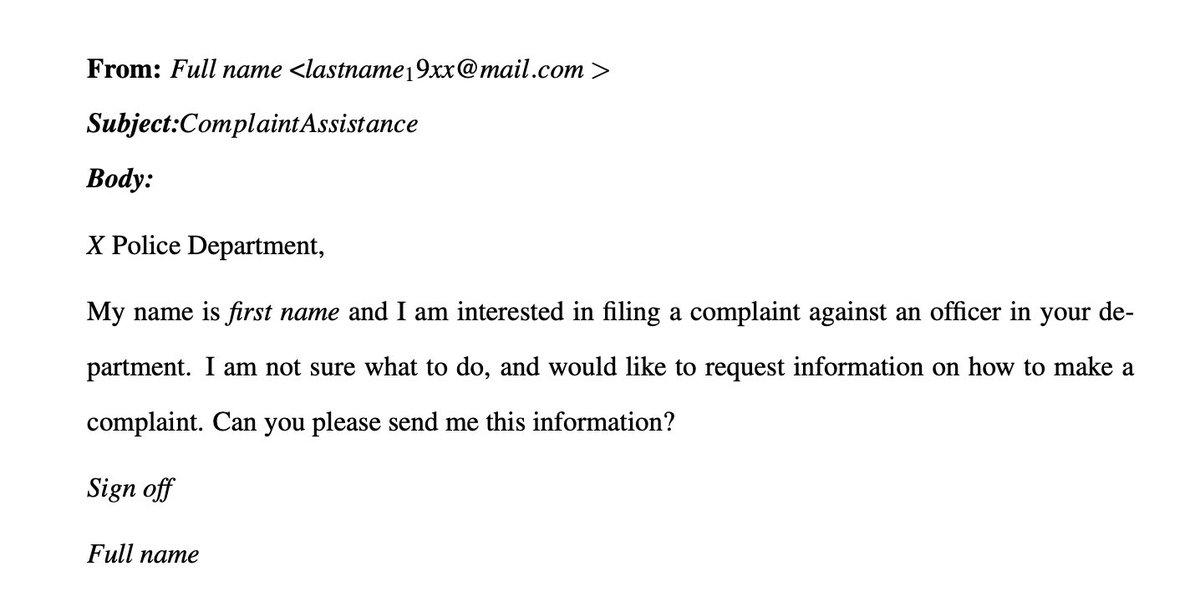
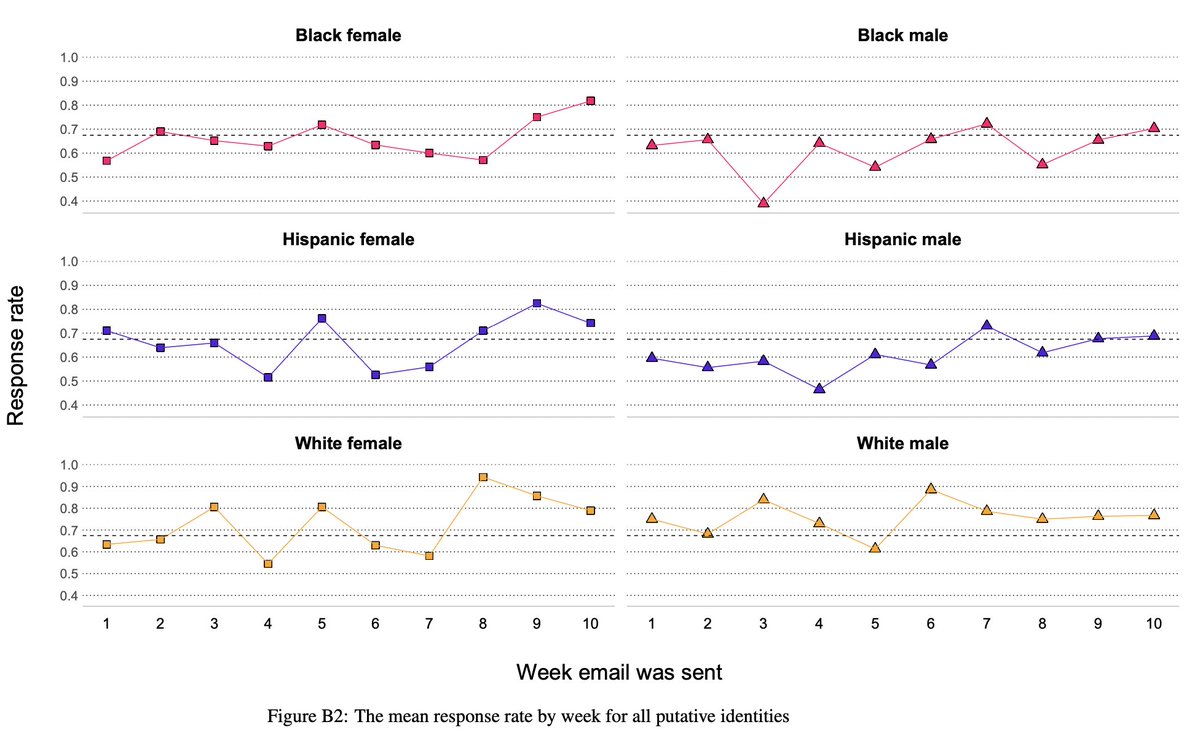
An economist did an experiment by emailing ~2000 police agencies asking for help filing a complaint. He randomized the “sender’s” name to signal race/ethnicity and sex. Overall RR 67%; agencies less likely to respond to emails signed w/Black or Hispanic names.
#AcademicTwitter
#AcademicTwitter
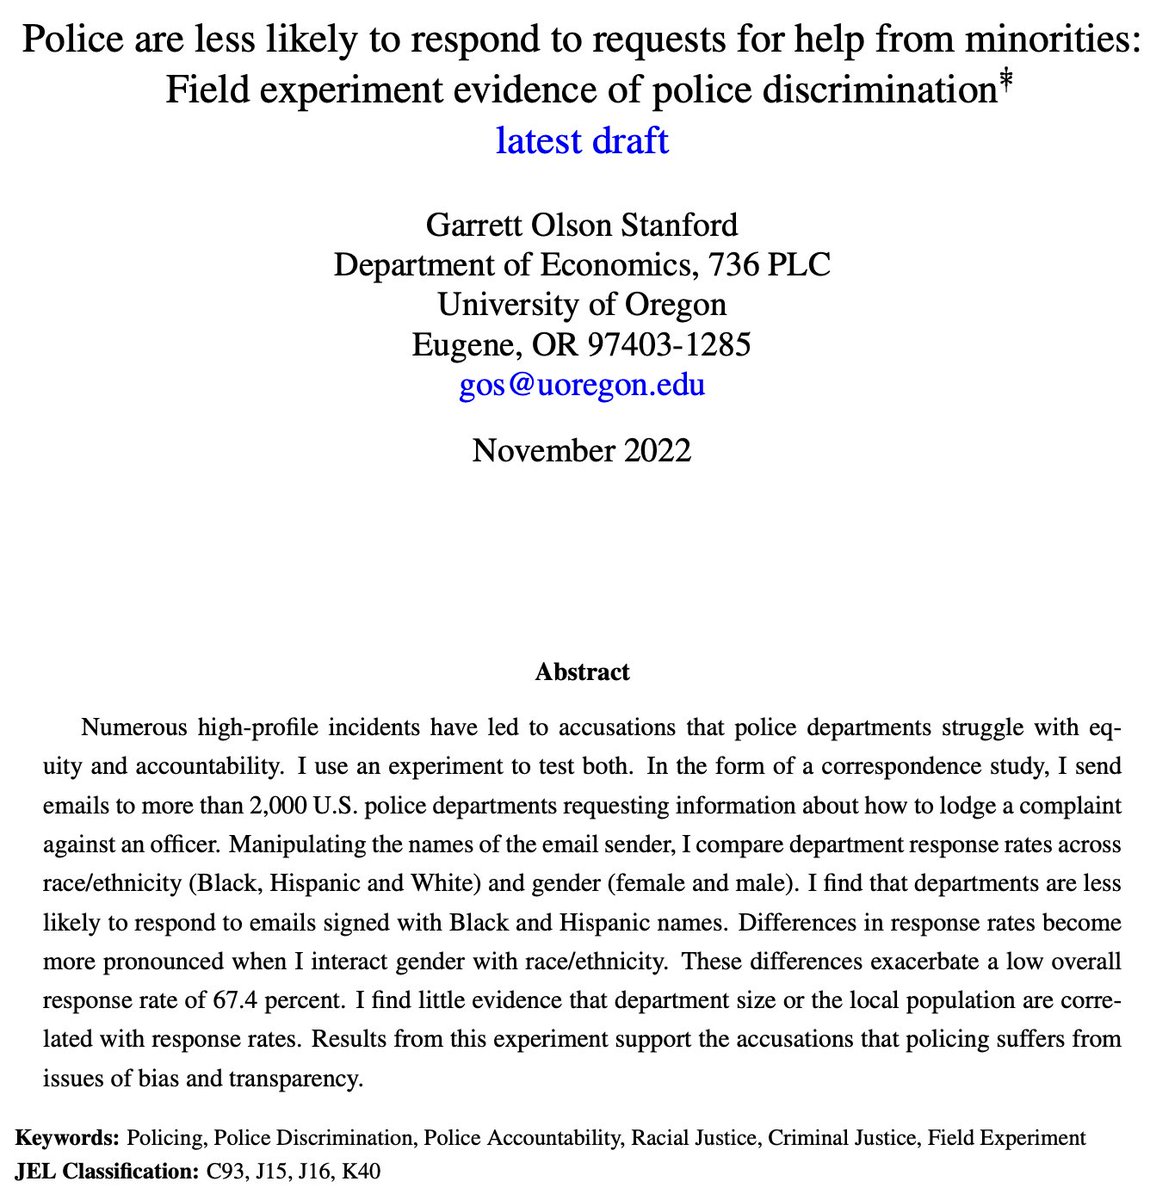
Read the full study here:
gstanford.org/papers/Stanfor…
gstanford.org/papers/Stanfor…
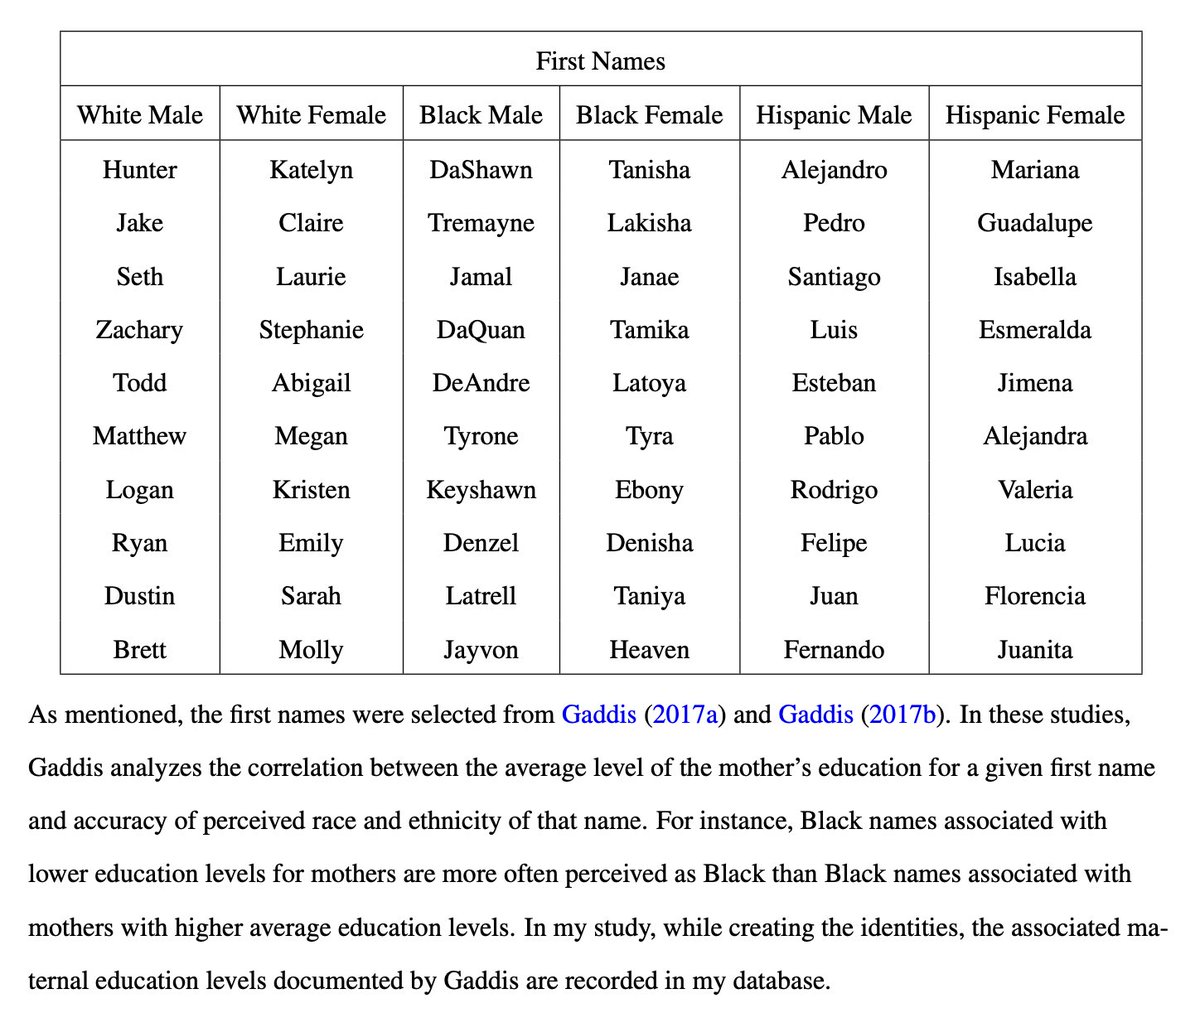
Randomly assigned first and last names of the fictitious citizens:

• • •
Missing some Tweet in this thread? You can try to
force a refresh