Bitcoin Bottom Signal Series.
A thread of on-chain signals which suggest the Bitcoin bottom is in, or very close. In my opinion, these are the most important on-chain metrics today. Based on Bitcoin's 13 year history, they are telling me this is an extraordinary opportunity.
A thread of on-chain signals which suggest the Bitcoin bottom is in, or very close. In my opinion, these are the most important on-chain metrics today. Based on Bitcoin's 13 year history, they are telling me this is an extraordinary opportunity.

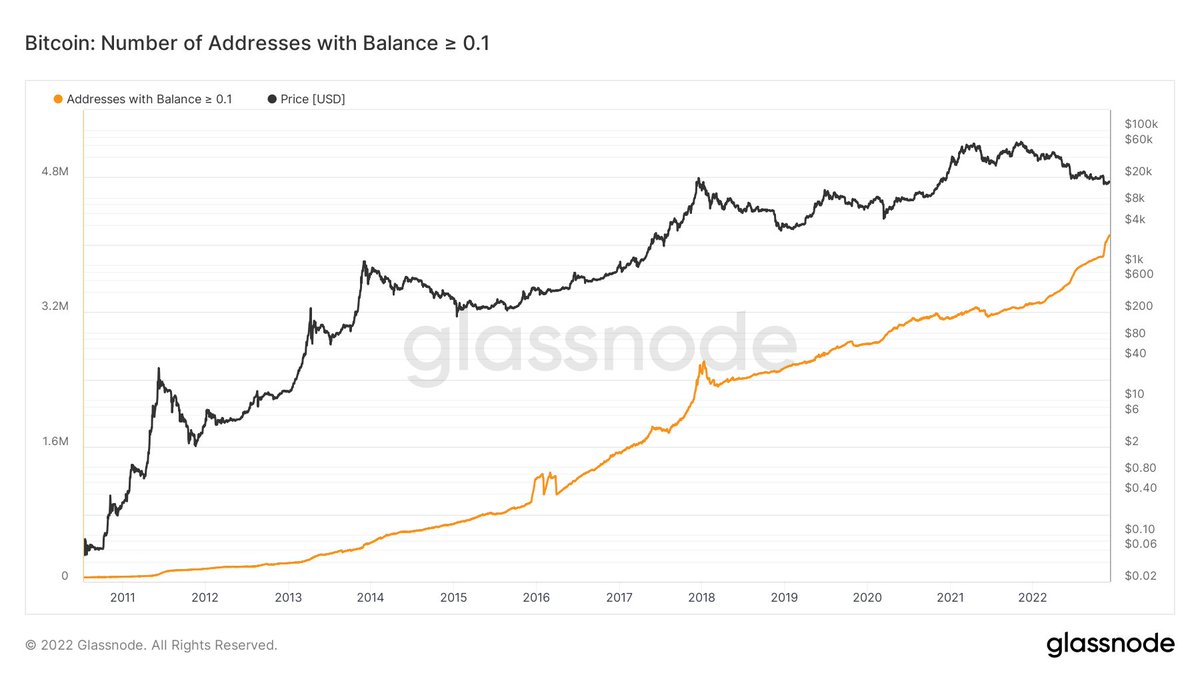
Adoption all-time-high. Despite a $10B fraud by FTX, Bitcoin adoption is screaming higher. We are witnessing one of the highest growth rates in addresses with >0.1 Bitcoin in history, seconded only by 2017. More and more people are locking away 1000s of dollars of Bitcoin.
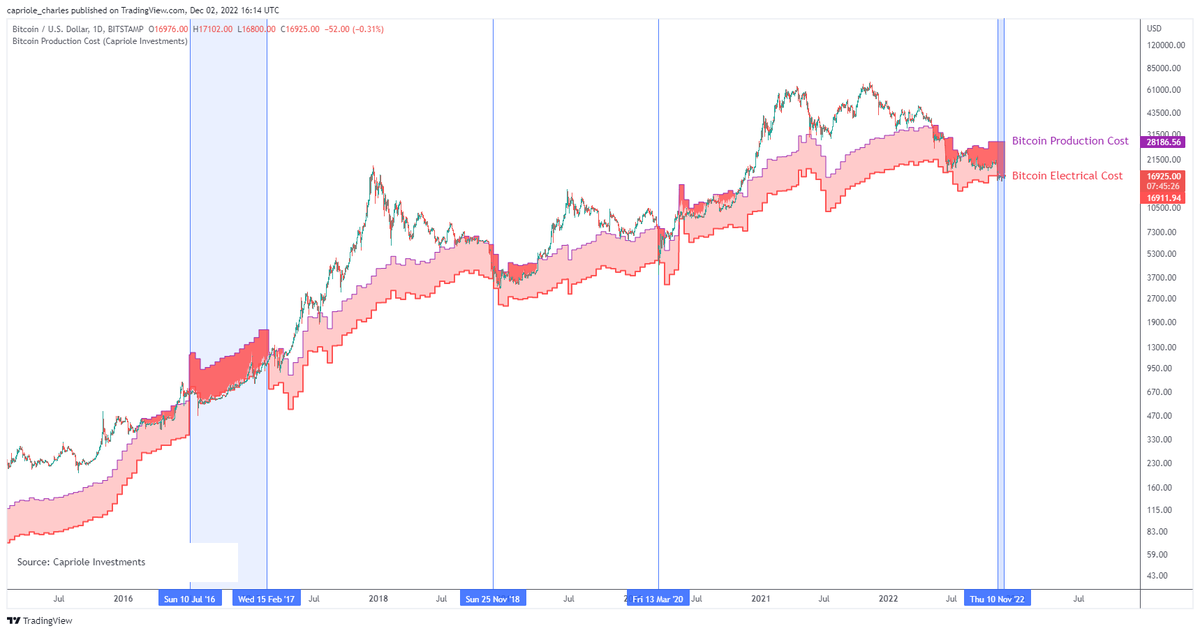
There have been only 4 periods ever of price below global Bitcoin Electrical Cost. A price point which has been a historical floor for Bitcoin. All looked like incredible buys in hindsight. You wanted to buy below electrical cost? We had a month there and now it's gone.
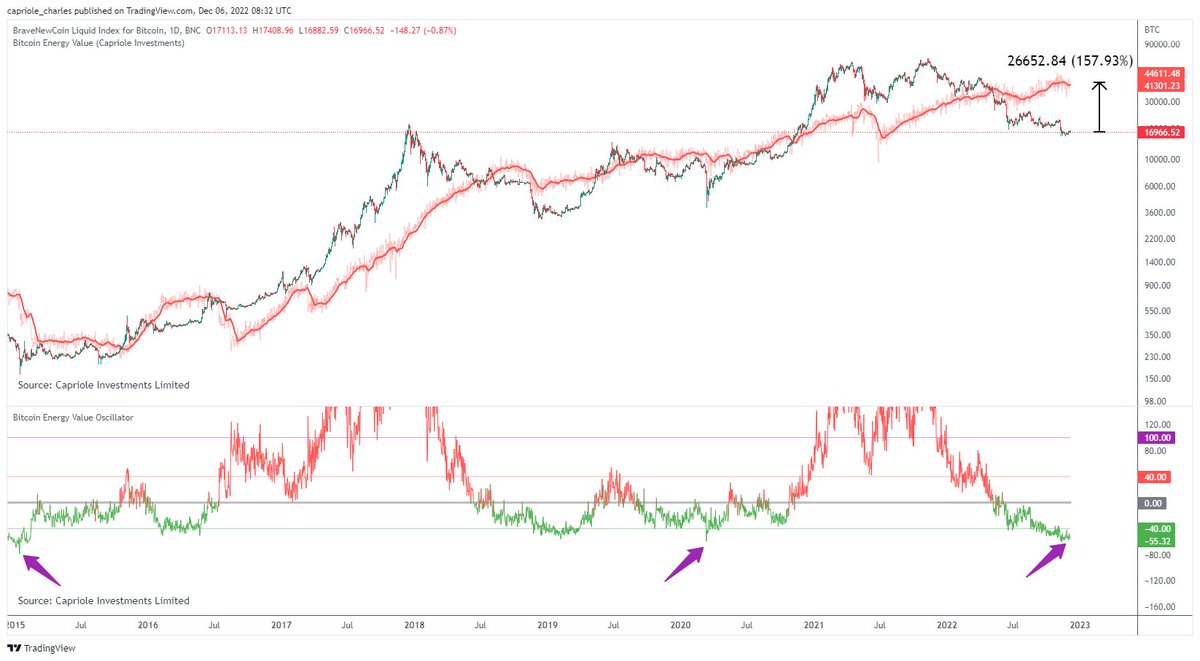
Price is trading at a 55% discount to Bitcoin Energy Value, Bitcoin's fair value priced using pure watts of energy in the network. That's the biggest discount since price hit $4K on 13 March 2020 and $160 on 14 January 2015. Bitcoin was 100X smaller then. Fair value today: $41K.
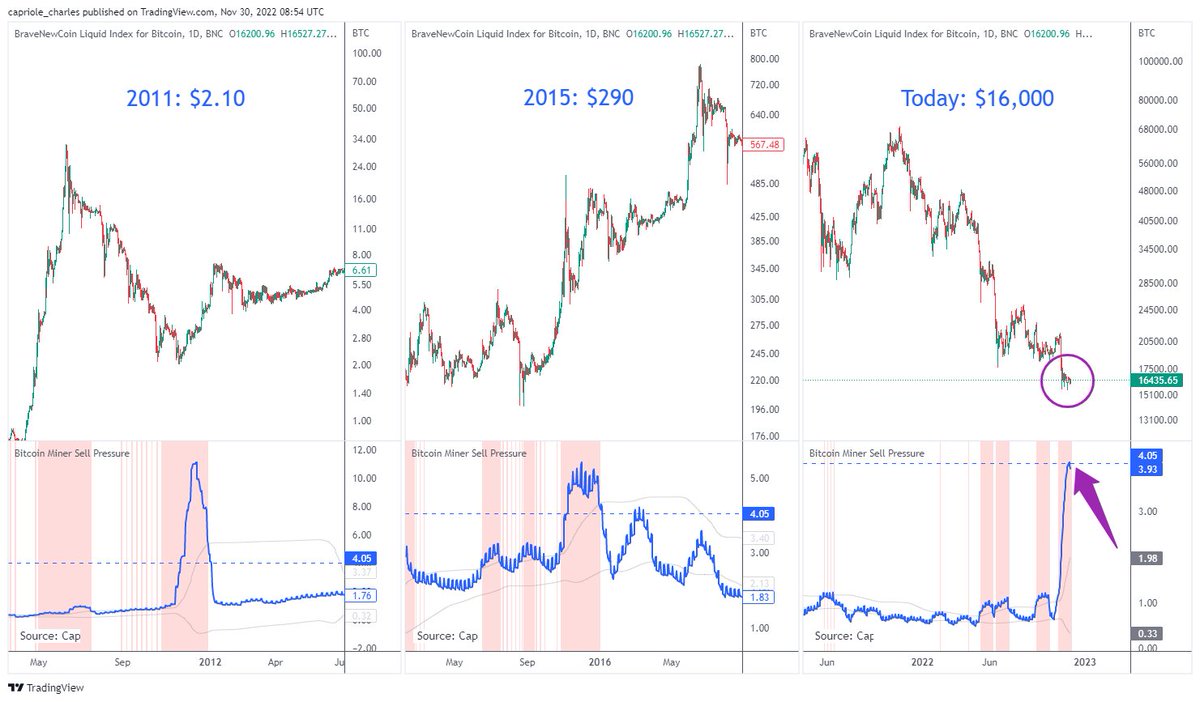
Bitcoin miner selling stress is at the 3rd highest of all time. The other times this occurred, price was at $290 and $2. I would love to have bought Bitcoin then.
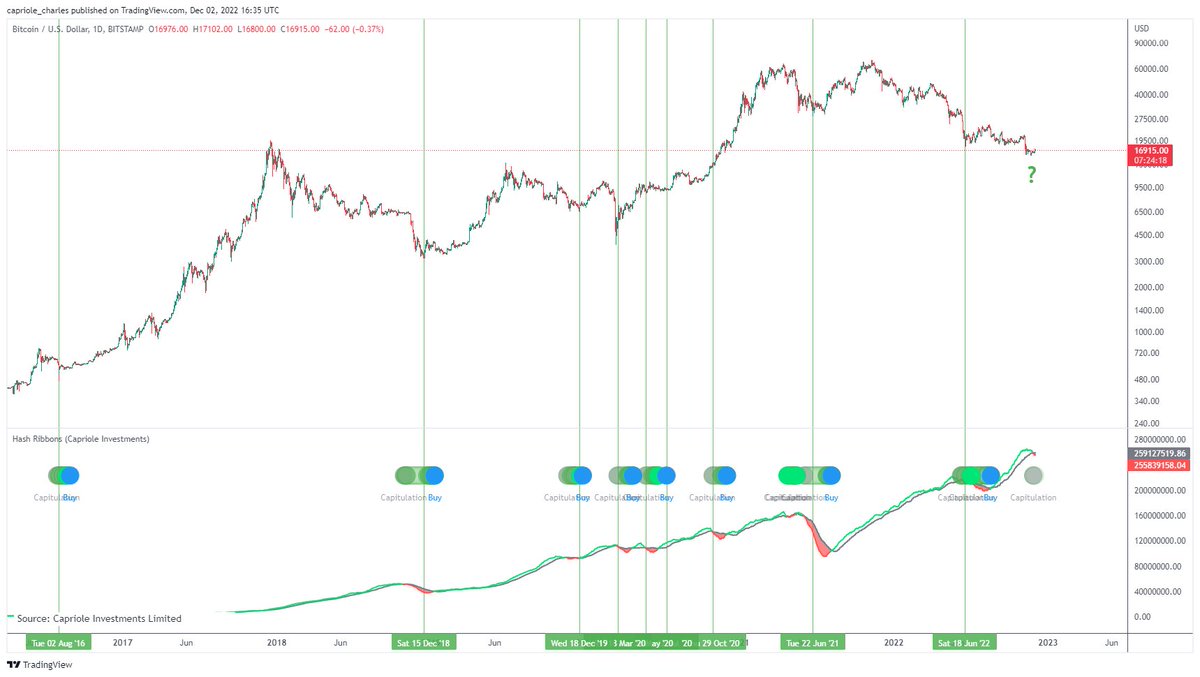
Deep value. Hash Ribbons has confirmed a miner capitulation. This is perhaps the best performing long-term buy signal for Bitcoin. A price low typically forms during the capitulation. Sometimes the first candle of the miner capitulation is the low.
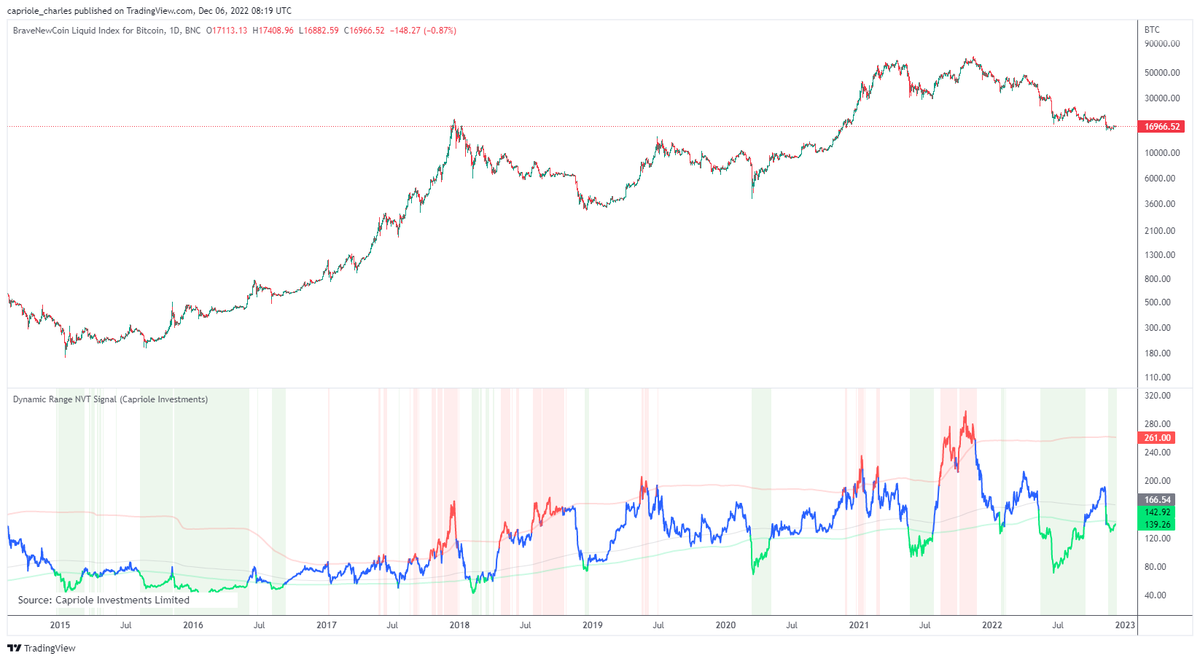
Dynamic Range NVT, the Bitcoin "PE Ratio", is once again in the green zone. This tells us the network is priced cheap versus the transaction value flowing through on-chain. My guess is we probably wouldn't be here if it wasn't for the FTX fraud, but somewhere in the mid-$20s.
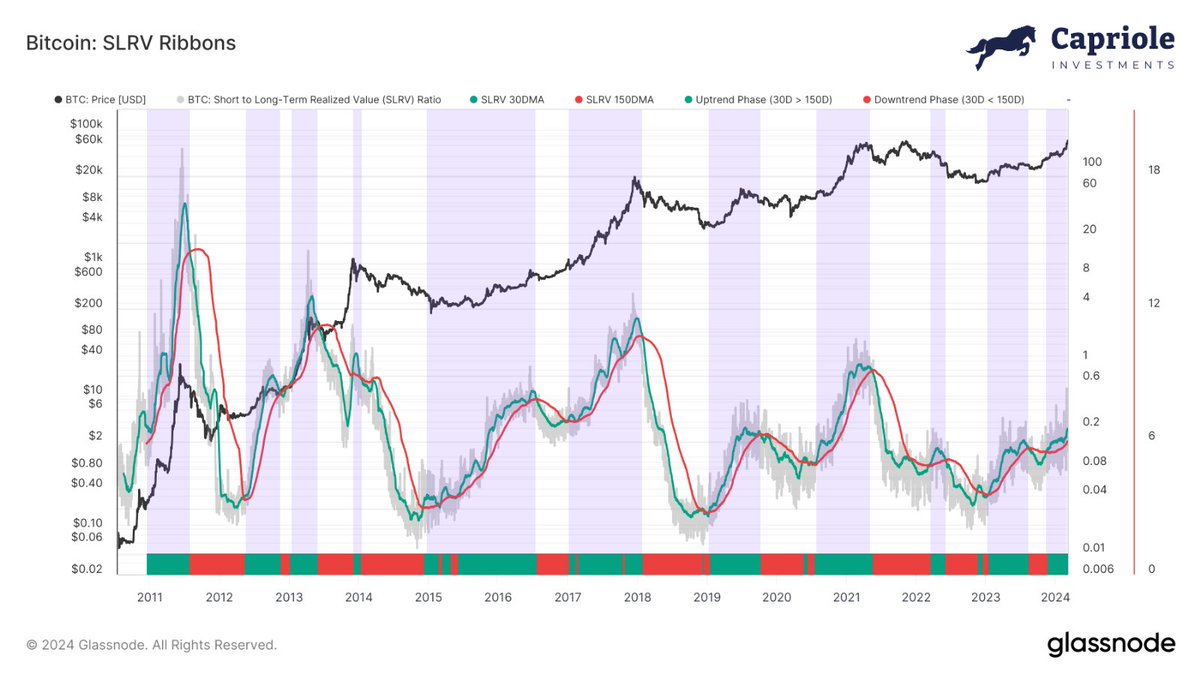
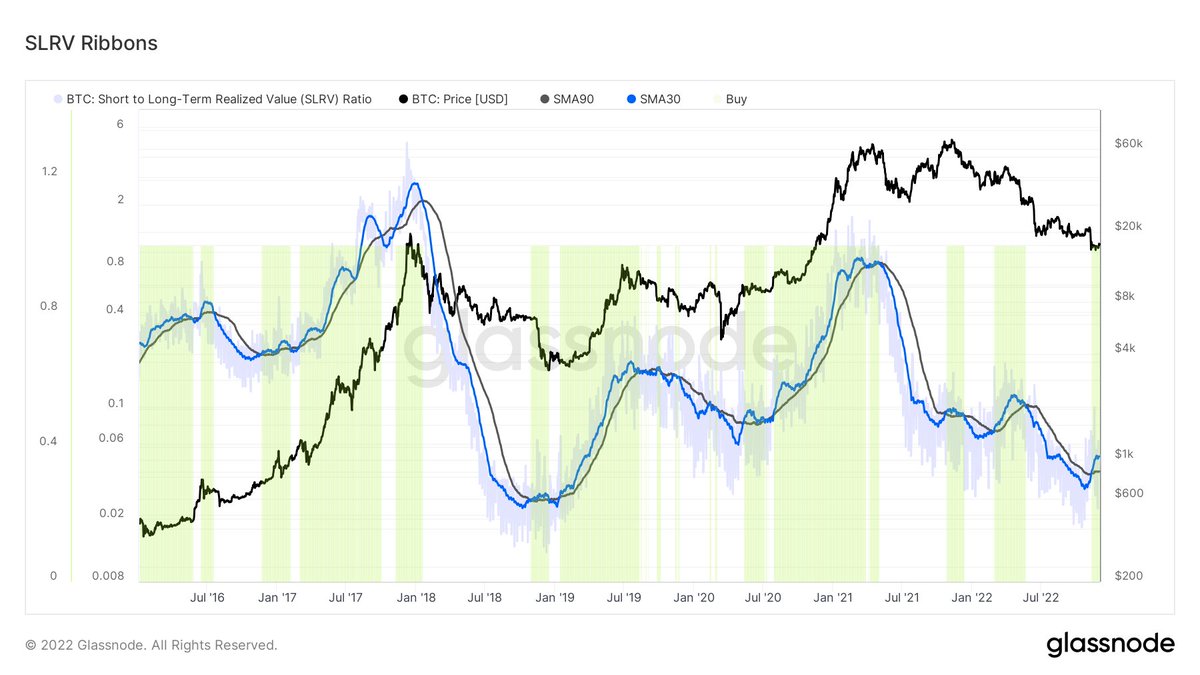
The SLRV Ribbons finally crossed bullish at $16.6K. This was one of the last major on-chain metric to flip bullish at the lows. You can read more about this strategy and how it beats buy-and-hold here:
medium.com/capriole/slrv-…
medium.com/capriole/slrv-…
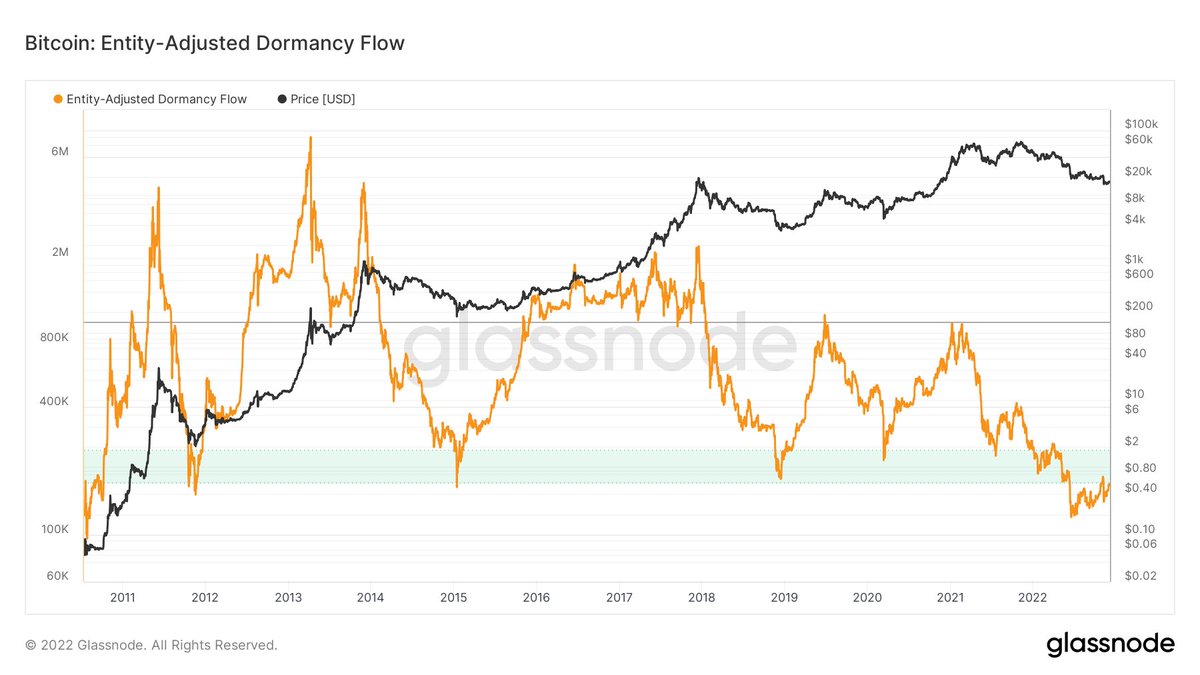
Dormancy Flow has spent much of the last months at all-time-lows. Per creator @dpuellARK:
"whenever dormancy value overtakes market capitalization at lowest longitudinal levels, the market can be considered in full capitulation — a good historical buy zone."
More deep value.
"whenever dormancy value overtakes market capitalization at lowest longitudinal levels, the market can be considered in full capitulation — a good historical buy zone."
More deep value.
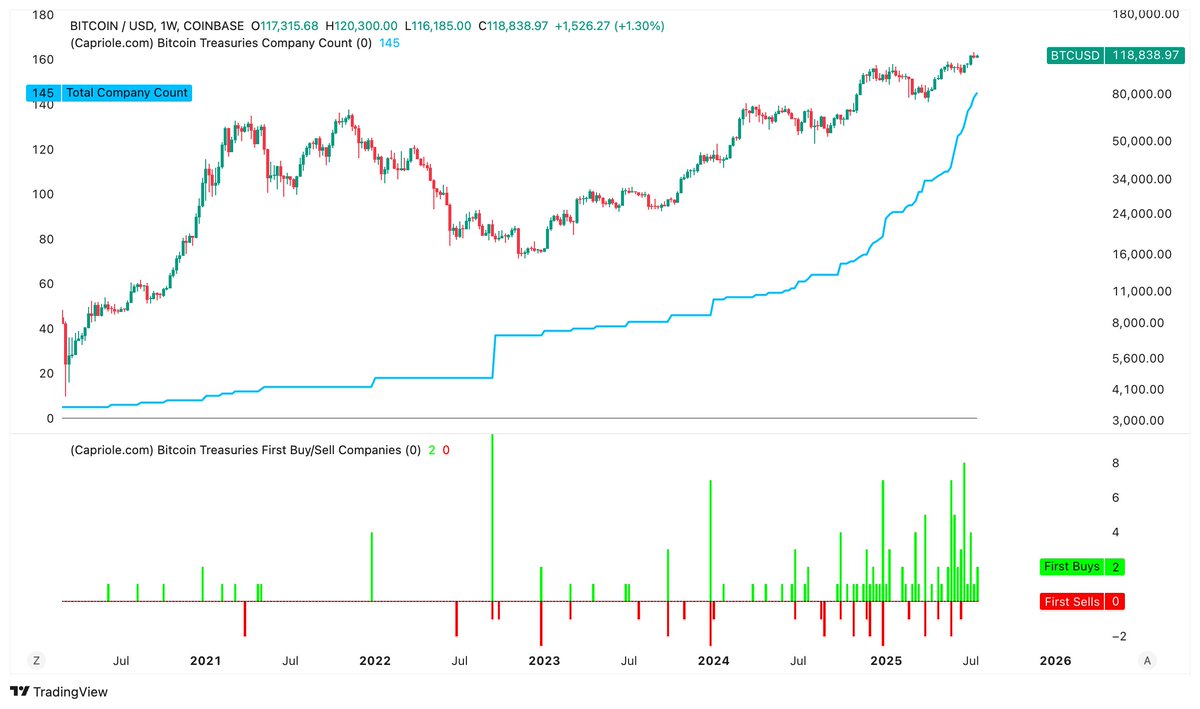
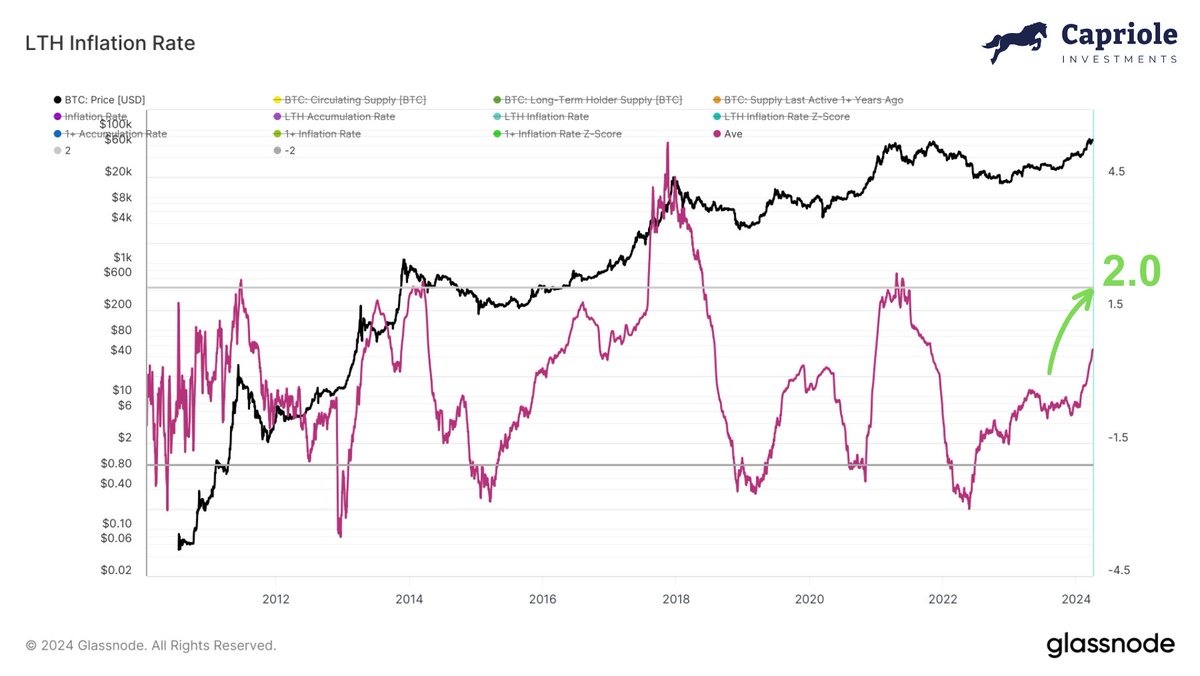
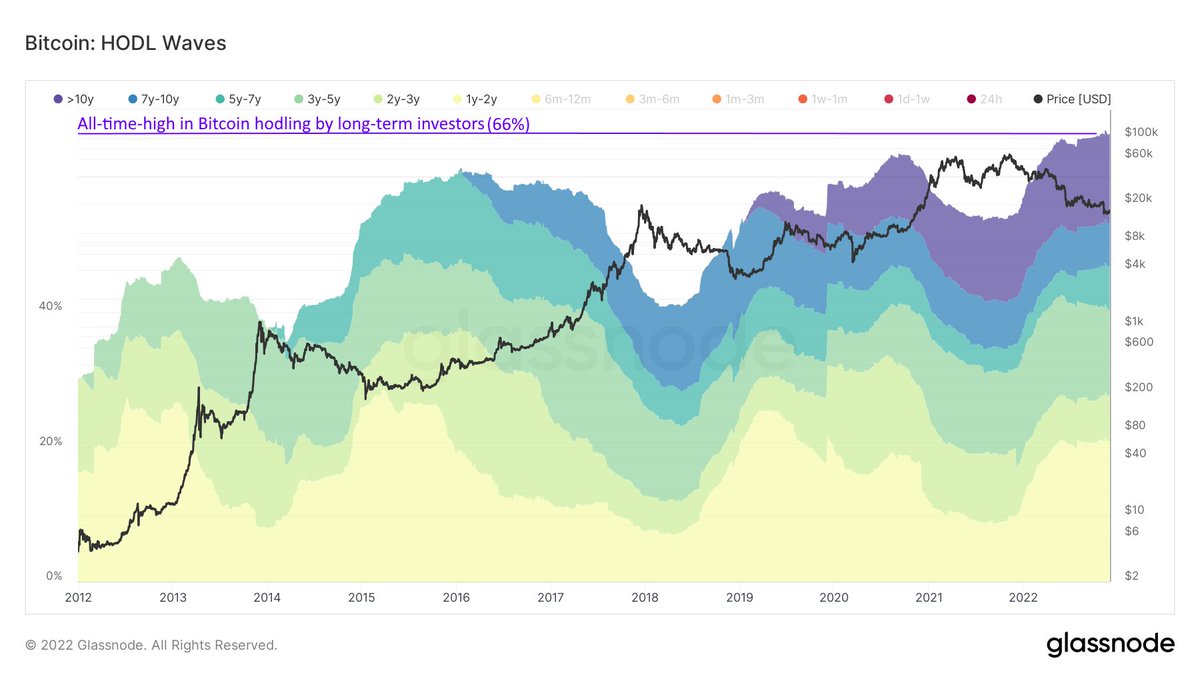
We have an all-time-high in long-term hodling. Those keeping Bitcoin at least 1 year now represent more of the network than ever before, 66%. Prior peaks of long-term holding all aligned with bear market toughs.
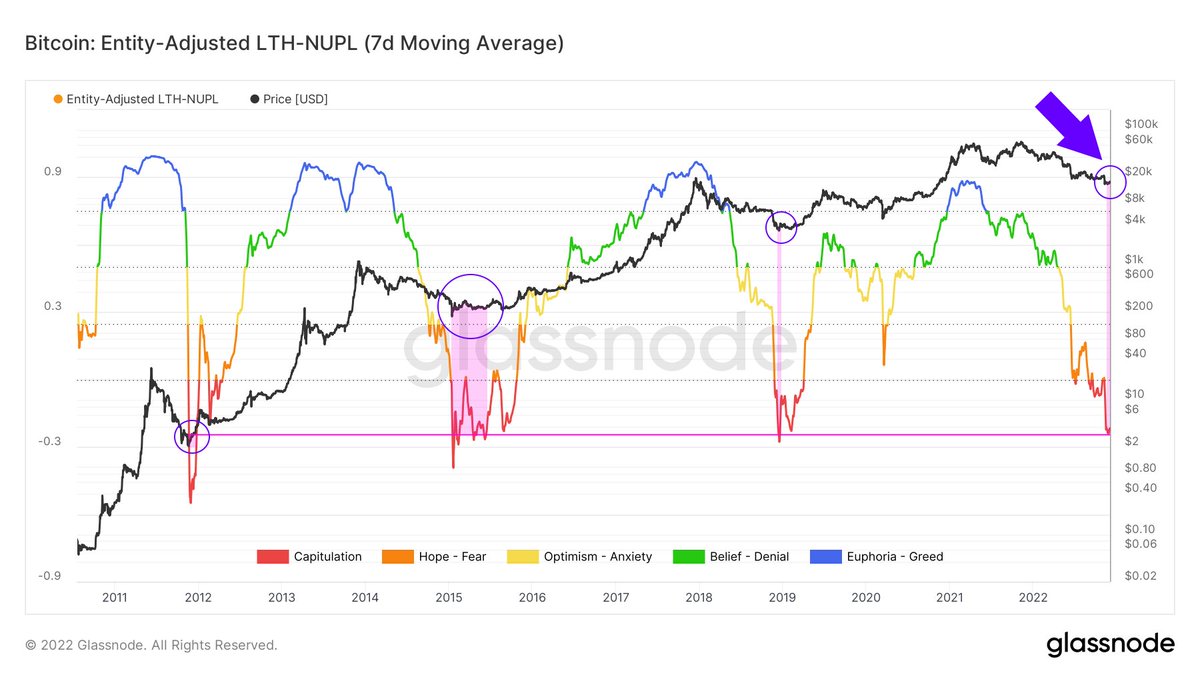
Many of these same long-term holders are in a deep downdraw. Downdraws have hit prior halving cycle lows in the -80% region. Sure it can always go a bit lower, but to me it's clear where the risk-reward is skewed on long-term holder NUPL.
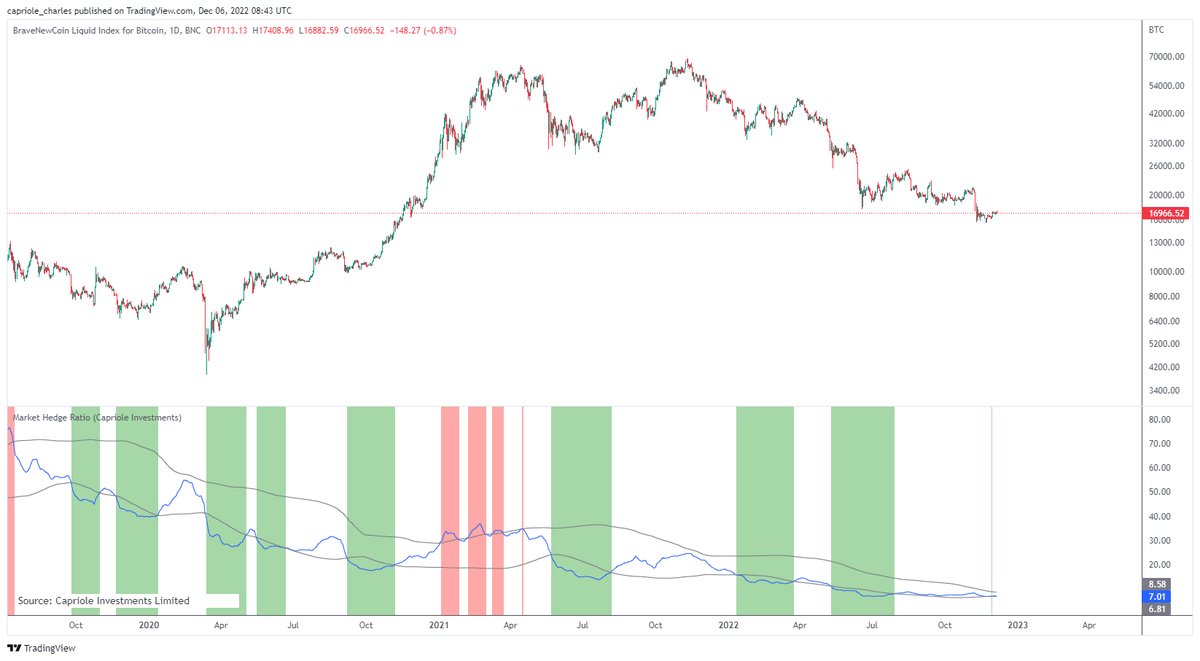
Looking at the main stablecoins USDC and USDT, the market is more hedged than ever before. People are not parking their savings in stablecoins if they are leaving this industry, this is dry powder waiting to be deployed. More than likely it will fomo into the next major rally.
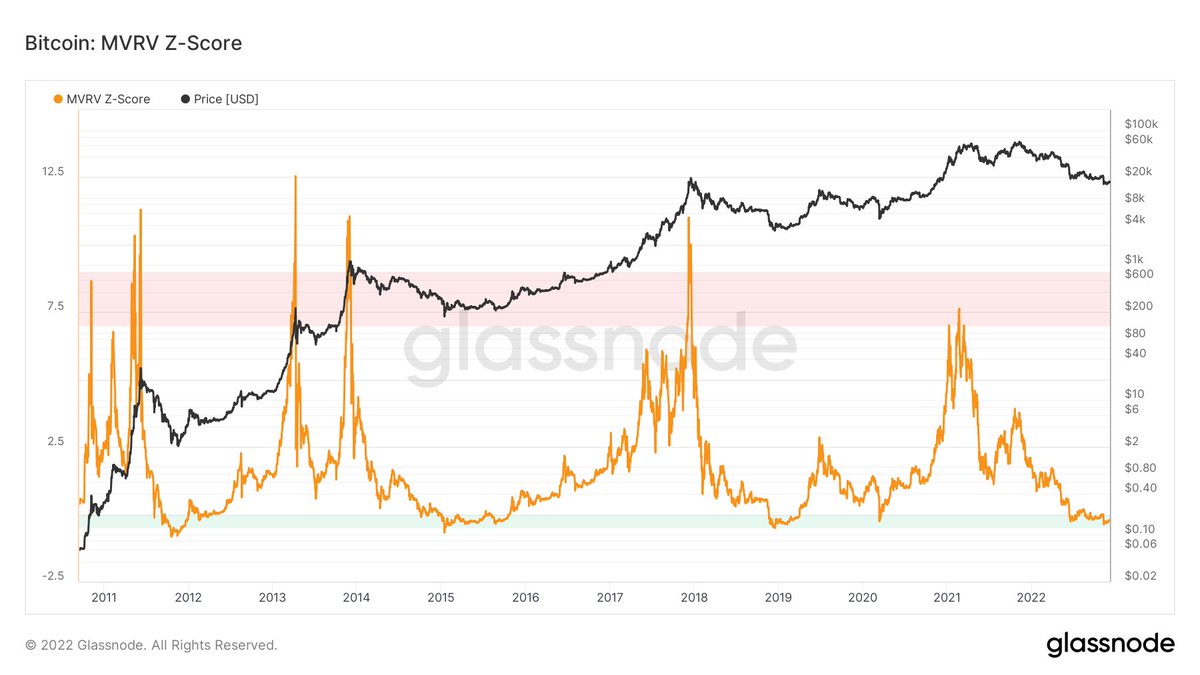
MVRV Z-score, today's market is priced incredibly cheap based on Realized Value. Depth and duration look uncannily similar to the prior cycle bottoms too.
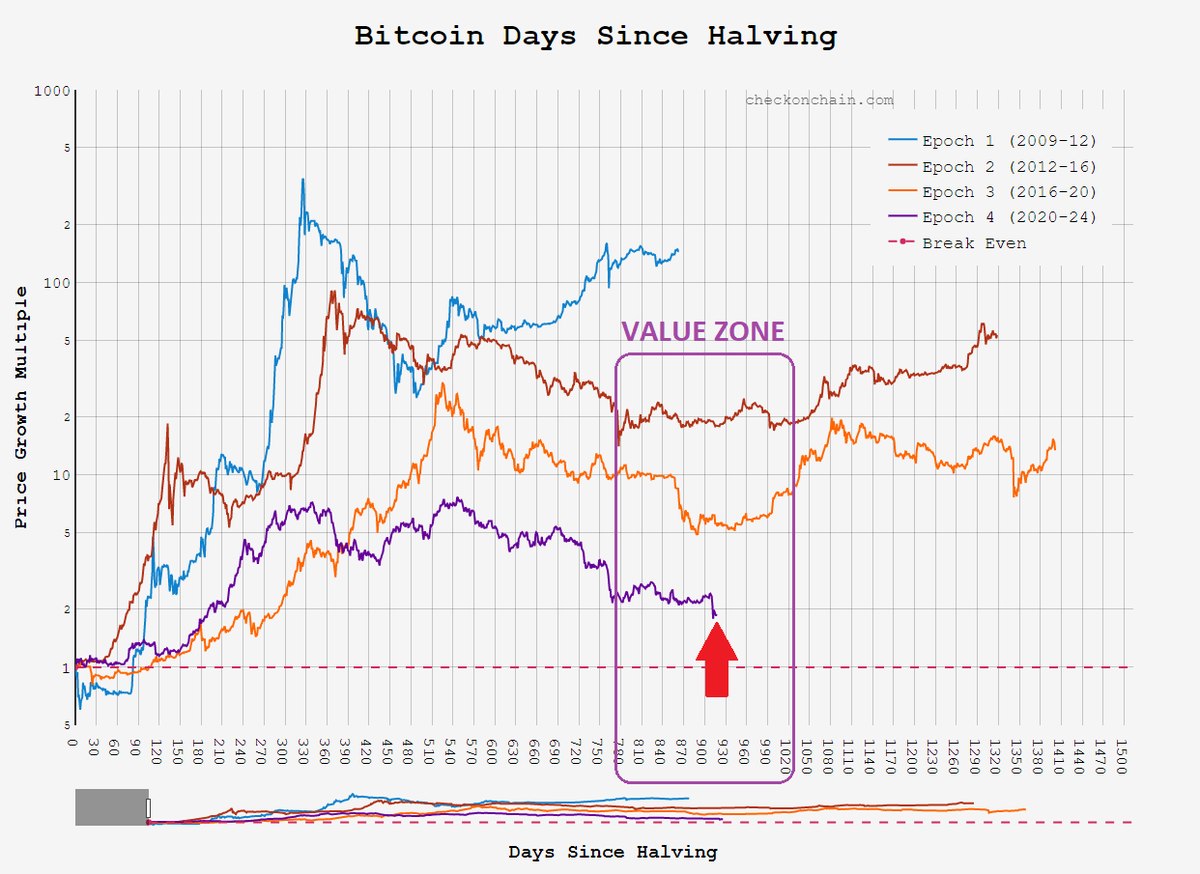
Finally, it's not just the data that is screaming "Bitcoin is cheap", but we are also situated smack-bang in the bottom zone for every prior Bitcoin halving cycle. This is where sentiment has always bottomed and the best long-term investments were made.
Summary:
✅Incredible miner stress and capitulation
✅Long-term holder capitulation
✅All-time-high adoption
✅All-time-high hodling
✅Largest ever store of stablecoin dry powder
✅Massive discounts on NVT, MVRV, Dormancy, +
✅Optimal cycle timing for a bottom
✅Incredible miner stress and capitulation
✅Long-term holder capitulation
✅All-time-high adoption
✅All-time-high hodling
✅Largest ever store of stablecoin dry powder
✅Massive discounts on NVT, MVRV, Dormancy, +
✅Optimal cycle timing for a bottom
For me, these are the most important Bitcoin investment metrics. But please do your own research, this is not investment advice. This thread focused only on on-chain data. I personally primarily invest using autonomous trading algorithms that manage my risk with @capriole_fund.
• • •
Missing some Tweet in this thread? You can try to
force a refresh