Charles Edwards Profile picture
Founder @Capriole_Fund and @The_Ref_io. Posts not investment advice.
Alexander Bastien Profile picture Ma$kiGT Profile picture 3 subscribed
Apr 2 16 tweets 9 min read
🚨 𝗠𝗔𝗝𝗢𝗥 𝗕𝗜𝗧𝗖𝗢𝗜𝗡 𝗧𝗢𝗣 𝗦𝗜𝗚𝗡𝗔𝗟𝗦 🚨

Forget price targets. This is a list of cycle top signals to watch.

How far away is the cycle top? Is it in? Image 1. Supply Delta + 90 Day CDD

These two metrics are great at identifying cycle tops. After they go vertical, watch for a rounded top in both metrics. Both these metrics have gone vertical today.

Watch it here: studio.glassnode.com/workbench/d411…
Image
Mar 6 16 tweets 6 min read
Bitcoin On-chain Deep Dive

🚨 The era of deep value is over 🚨

A thread covering 10 on-chain metrics I created.
Here's what they say about Bitcoin today and where we go from here...

A new chapter has begun. Image Bitcoin Energy Value. Bitcoin's intrinsic value priced from the pure Joules of energy into the network only. No wacky formulas, no power laws. Energy alone maps the fair value of Bitcoin from inception. Currently at $70K, making Bitcoin fairly valued for the first time in 2 yrs. Image
Feb 5 7 tweets 3 min read
If Bitcoin's post Halving returns are the same as 2020, we are looking at $280K Bitcoin next year.

You might reasonably argue this cycle's returns are less than 2020.

However, I believe the 2020 cycle performance was mediocre and an outlier. Image 2020 was the worst Bitcoin bull market in history. I believe overall performance was pinned down due to the -50% destruction of mining network by China _and_ the most aggressive Fed tightening cycle in history.

These were two massive, stagnating forces on Bitcoin. The magnitudes of which we are highly unlikely to see again in the next 2 years.Image
Feb 28, 2023 11 tweets 2 min read
January was massive for Bitcoin, not just because price went up a lot. I believe it was the start of the bull market for Bitcoin for these 9 reasons: 1. We exited a period of multi-month deep value as defined by many on-chain metrics, including trading at its electrical cost for 2mths ending. Historically this is the global price floor for Bitcoin and was the 2nd longest time spent at the electrical cost in Bitcoin’s history.
Dec 17, 2022 6 tweets 2 min read
This FUD is really bad for the industry. I haven't seen anything backed by data that is legitimately concerning, but when fear is great enough, it doesn't matter. If current withdrawal rates continue, expect more exchanges to go down - not from poor practices - but bankruptcy. Exchanges are being hit by a 80%+ decline in pricing, 90%+ decline in volumes & now 50+% reduction in reserves from irrational panic. Businesses that didn't plan ahead for a 95%+ drop in revenues will be struggling here. At the least, expect a lot more redundancies across crypto.
Dec 6, 2022 16 tweets 6 min read
Bitcoin Bottom Signal Series.

A thread of on-chain signals which suggest the Bitcoin bottom is in, or very close. In my opinion, these are the most important on-chain metrics today. Based on Bitcoin's 13 year history, they are telling me this is an extraordinary opportunity. Adoption all-time-high. Despite a $10B fraud by FTX, Bitcoin adoption is screaming higher. We are witnessing one of the highest growth rates in addresses with >0.1 Bitcoin in history, seconded only by 2017. More and more people are locking away 1000s of dollars of Bitcoin.
Nov 11, 2022 5 tweets 2 min read
Bitcoin miners are in pain and selling more than they have in almost 5 years!

Introducing: Bitcoin Miner Sell Pressure.

A free, open-source indicator which tracks on-chain data to highlight when Bitcoin miners are selling more of their reserves than usual. 
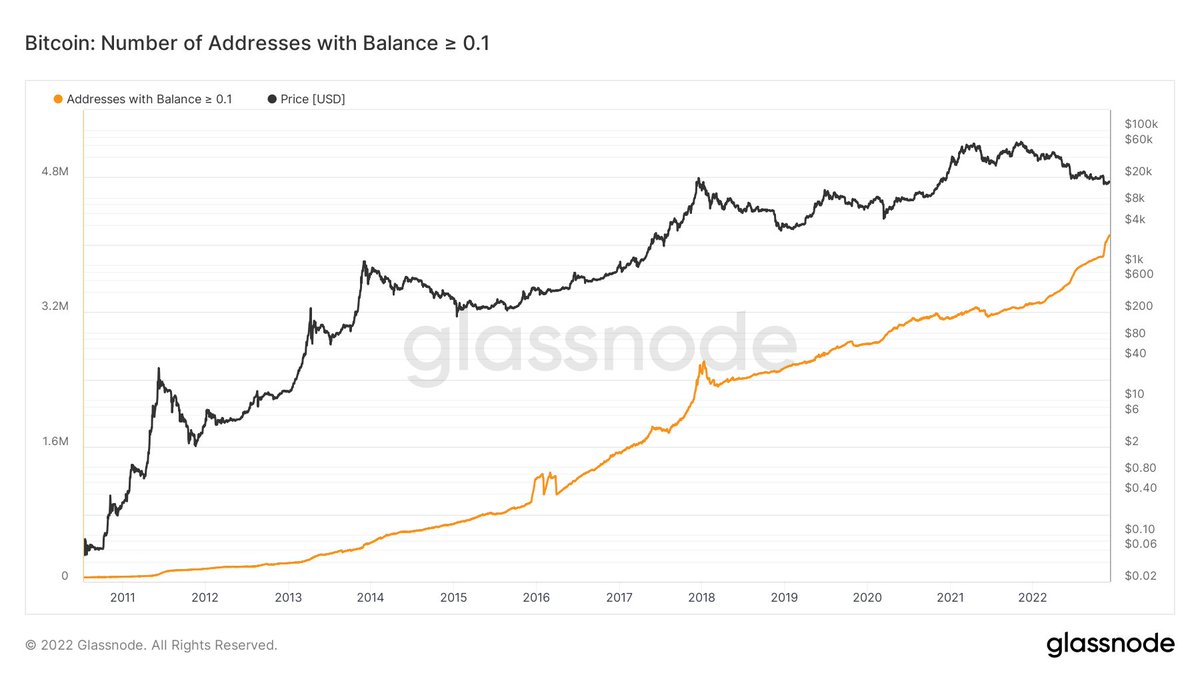
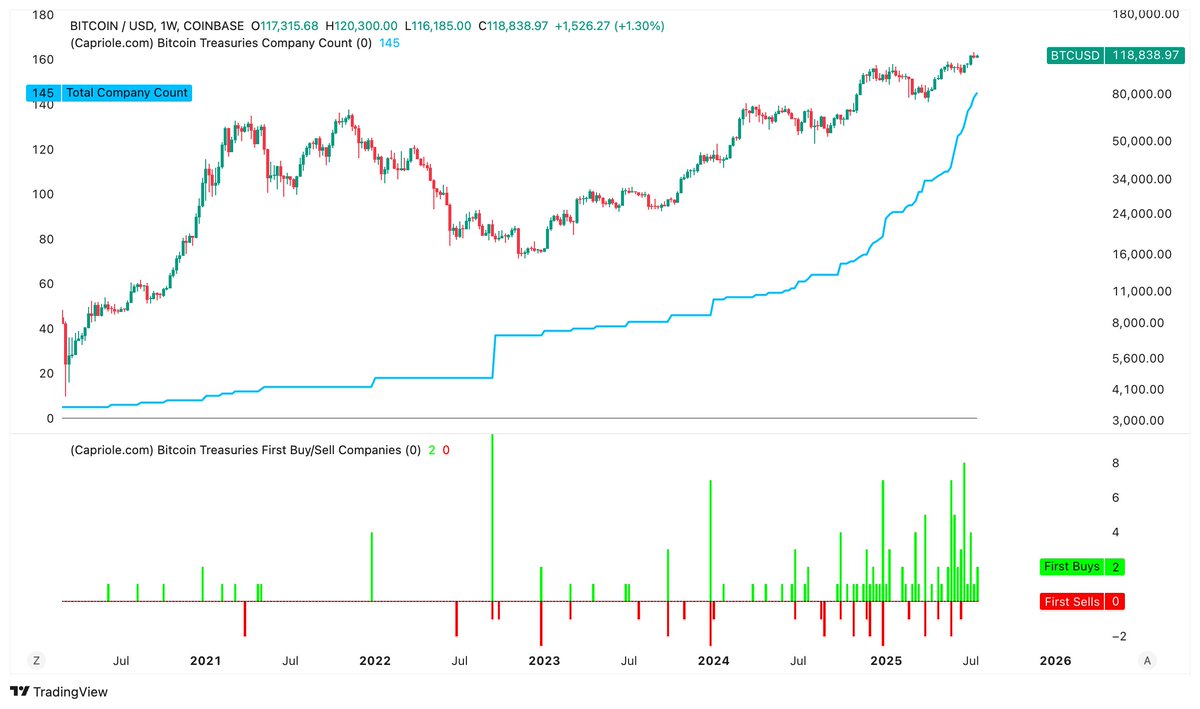
The indicator tracks the ratio of on-chain miner Bitcoin outflows to miner Bitcoin reserves.

- Higher = more selling than usual
- Lower = less selling than usual
- Red = extraordinary sell pressure

Today, it's red.
Nov 2, 2022 6 tweets 2 min read
Introducing: The Bitcoin Yardstick

Today we are seeing valuations unheard of since Bitcoin was $4K.

A very simple, rule-of-thumb Bitcoin valuation tool.

Bitcoin Yardstick = market-cap / hash-rate, normalized over 2 years of data.

As always: not investment advice.

A short🧵 Similar in concept to a PE Ratio, except instead of stock earnings, the Bitcoin Yardstick is taking the ratio of energy work done to secure the Bitcoin network in relation to price.

Lower readings = cheaper Bitcoin = better value.

2/6
Aug 3, 2022 15 tweets 6 min read
The 12 Bitcoin Capitulations.

The raw count of evidence for major Bitcoin capitulation today is insane.

Each occurrence alone is a rare event and adds to the probability that forward risk-returns are skewed positively.

Let’s take a look at the 12 signs #Bitcoin capitulation: (1) Supply transferred at a Loss (NEW METRIC).

The percentage of total supply transferred at a loss hit 1.9% last month. Historically, when this metric breaches 1.5% it demonstrates that a large portion of the market is in pain. Most were also great accumulation zones.
Jul 31, 2022 13 tweets 3 min read
𝗦𝘂𝗿𝘃𝗶𝘃𝗶𝗻𝗴 𝘁𝗵𝗲 𝗯𝗲𝗮𝗿

There are only 2 ways to survive a crypto bear market:

(1) Unleveraged hodling for dear life
(2) Trading (in attempt to “buy low and sell high”)

🧵 Image None of this thread is investment advice. There are always outliers to the norm. Do your own research and make an informed decision!

These are just some of my personal insights from weathering this highly volatile market the last 5 years.
May 11, 2022 15 tweets 4 min read
My bear market dream is buying at the Bitcoin Electrical value price. So currently around $23K.

But during Bitcoin's life, we have never had a proper, lasting tradfi bear market.

The S&P is only down -18% (nothing) so far.

This changes everything...

1/n 2/

While a lot of metric are oversold, suggesting we are due for a short-term bounce, a lot of tradfi charts are turning really sour.

Equally weighted S&P500.

Can a topping formation get much uglier than this?
Feb 24, 2022 8 tweets 2 min read
Impact of war on markets.

Generally speaking, invasions mark bottoms.

However, the most recent wars on record were relatively small and did not involve a significant risk of potential escalation to a direct conflict between multiple major powers.

The Ukraine war could. Image Perhaps a better comparison to today's Ukraine war is the pre-information age conflicts, such as Korea and WW2.

From onset, these had an average draw down of -16%, bottoming within 1-5 months.

Assumes Russia is seeking an empire building campaign, potentially with others. Image
Jan 26, 2022 9 tweets 3 min read
1) A short thread on @Helium HNT.

The world’s fastest growing wireless network ever and why it's changing the telecom game.

👇 2) Note:

Capriole has a position in Helium since mid-2021.

This is not investment advice.
Jan 2, 2022 10 tweets 3 min read
History suggests the beginning of rate rise regimes actually result in stock market strength for 6 months.

10 of the 13 regimes (77%) since the 1950s had positive stock market returns over the first six months, averaging +5.1%.

We are approaching the start of a new regime now. All else equal, a bullish stock market is good for #Bitcoin.

As we have we seen in 2021, the two markets have become increasingly joined at the hip.
Nov 15, 2021 4 tweets 1 min read
Bitcoin is notoriously bad at pricing events in.

Remember what happened last halving?

Yea, Taproot just happened this weekend. Taproot unlocks massive value on the Bitcoin network.

Lighting gave capability for legal tender and country adoption. We are just seeing the beginning of this with El Salvador.

Taproot gives greater security and unlocks massive potential for application development.
Sep 21, 2021 15 tweets 3 min read
How healthy is US debt?

The US came out of WW2 with a lot of debt.

The good news today:

At the federal and public level, debt-GDP today is less than post-WW2 and falling.

The bad news:

The private sector has been taking on a massive debt burden. The Post-WW2 stock market rally was fueled by real economic growth. GDP was rising faster than the growth in money supply.

However, since the 2000 tech bubble, the US has not seen any real GDP growth.

The money supply has been growing a lot faster than economic output.
Jul 1, 2020 5 tweets 2 min read
It's almost impossible to find a growth "value stock" in 2020.

But dividend payer @NexoFinance is a "value crypto".

"Experiencing double-digit percentage growth rates month on month."

...and it is trading at under 50% of its fair value today.

medium.com/nexo/bullish-o…
1/5
When almost everything in the stock market is overvalued, it's a rare gem to find something trading as a 50c dollar with insane growth rates.

In August, I valued Nexo at $0.26 using DCF, it was then $0.077, a 240% discount on intrinsic value.

Today Nexo is $0.23.

2/5
May 12, 2020 20 tweets 6 min read
Happy Halving!

Given the interest in Bitcoins Production Cost, I will offer my thoughts on a more recent study into mining cost by @BlockwareTeam

TL; DR: assumptions used in Bitcoins Production Cost are still accurate today, but will likely need revision in near future. 1/
The Blockware article is a great “bottom up” analysis of miner behavior and market dynamics:
blockwaresolutions.com/research-and-p…

The approach used in Bitcoin Production Cost (and the indicator) is “top down”:
medium.com/capriole/bitco…

There are pros and cons to both methods.
Apr 25, 2020 5 tweets 2 min read
Hash Ribbon Buy

The Bitcoin Buy signal which occurs about once a year just fired.

Note: The halving is just 2 weeks away. Expect another signal within the next 3 months, like 2012 and 2016. Historically this means that the next 30 days is a great time to accumulate more Bitcoin.
Feb 16, 2020 15 tweets 6 min read
My #Bitcoin Forecast

🚀Bitcoin $100K within 5 years

Based on a conservative estimate of Bitcoin’s Energy Value, it is likely that $BTC will 𝟭𝟬𝗫 within the next 5 years.

A thread forecasting Bitcoin’s long-term price using Energy Value.

1/n 𝗔𝗽𝗽𝗿𝗼𝗮𝗰𝗵

Bitcoin’s Energy Value has tracked Bitcoin’s price for the last 10 years.

Let’s use it to forecast price.

There are only two varying inputs in Energy Value:
⚡️Hash Rate
⚙️Mining Hardware efficiency

We can forecast each of these to predict BTC's Price.

2/n
Oct 29, 2019 4 tweets 3 min read
New finding on Dynamic Range NVT!

When NVT Crosses the 2yr ave, an NVT "overvalued signal" occurs on average 103 days later.

What does this mean?

BTC rises 108% on ave over the following 3mths.

Guess when the last signal was?

Just 18 days ago.

@woonomic @cryptopoiesis @woonomic @cryptopoiesis Some of the stats:
- 8 out of 14 occurrences since 2013 resulted in an "overvalued" signal touch within 100 days
- 11 out of 14 hit within 200 days
- The average draw-down, if you sell when signal crosses back under the ave, is -6%