$SMMT Alright thread time. Here is a stupidly bullish lvl 2 signal that maybe happens once per month. Anyone who follows manipulation knows riggers paint lower highs then initiate a squeeze. Sometimes they do this by having HUGE asks or hidden sellers at key levels.
But think, do you think anyone is legit trying to sell 900k shares and showing it on the lvl 2 for everyone to see? Fuck no, especially on clearly rigged/strong stocks. They are just trying to build enough short stop losses and shake out enough scared longs before the squeeze.
At 1:45pm on $SMMT they finally brought the tape back up to that lvl and both of those offers at $2.23 and $2.24 were GONE. Guess what? Every stop loss above that gets triggered and they initiate the 30% squeeze.
Here’s another example, $TBLT on 11/14/2022. Here are the lower highs they painted. Here are the offers they showed. Clearly rigged manipulated ticker. They often take out support before initiating the squeeze.
These are often A+++ long signals. I already pointed out variations of this recently with a MASSIVE hidden seller on $MMAT on 11/21/2022 or someone hard refreshing the ask on $SHPH on 12/5/2022.
Btw it can also happen in the OPPOSITE direction, specifically on bid props. On the $PEGY bid prop on 10/5/2022 they were flashing this bid on a clear higher low prop. In this context with these technical on a strong stock, it all but guaranteed the crack.
Record your tape and your chart, this shit happens over and over. I maybe use lvl 2 on 5% of my trades, but holy shit when the lower highs chart painting shows up and the lvl 2 starts doing this, it drastically increases it’s chances for a squeeze. Vice versa with the bid prop.
• • •
Missing some Tweet in this thread? You can try to
force a refresh
I mostly use moving averages as a guide on strong/rigged stocks. You don't need to use them if you don't want. Plenty of successful traders don't. When shorting I find it most useful for profit taking partials. The only short setup I sometimes use it for are bid props.
$AGRI on 3/10/2022 - here's an example of all 3 uses. Crazy strong commodity stock up the 3m9/3m20 in the morning. Starts bid propping on the 3m50ema midday. Struggles to push, cracks the ema, fades to final price target 3m200ema.
$PEGY on 10/5/2022 - same thing. Up the 3m9/3m20 in the morning. Props on the 3m20 after the huge push, prop again on the 3m50 on the next pullback, final price target of 3m200 which its exact bottom before the afternoon squeeze.
You know I need a new pinned tweet. So I'm gonna post all my favorite @team3dstocks threads that have personally shaped my thinking. These tweets are based from my 637 page, 106,909 word document I put together during my early years and pretty much made me profitable.
On super strong stocks in strong markets - you can get good short patterns with fades. But they often fade, soak midday, then push afternoon. On manipulated backside fades, higher lows are often weak, and lower lows are often strong. This can help set your expectations.
Should mention there there is a behavior change in the afternoon where, after a strong, manipulated stock has faded far enough, it sets it's lower lows, then starts grinding up with higher lows midday/afternoon for the big squeeze. Usually bounces of a key moving average.
$SONN and $PALI were the only truly strong stocks this month to really show this. Great wait to frustrate longs looking for a bounce on the fade, and great way to frustrate shorts looking for a support crack on the bounce. All one big game.
@DonaldJoyDJ Yes, I actually made a youtube vid about this.
(1/x) Overall you NEVER want to short at the bottom of the clearout. That's what noobs do and they get owned when the stock soaks at support then squeezes. What you want to learn is how to ANTICIPATE them
@DonaldJoyDJ So what often happens before those 10:23am candles is it forms a tight clear range right below some key resistance level. In this case it's a combination of vwap and the top of the range it formed $4.20. Also the longer that tightness exists (14 minutes here) the better
@DonaldJoyDJ What's happening is a bunch of shorts are shorting into the weakness after the pullback at $4.40. They are all loaded up and risking just above vwap/$4.20. So the manipulator targets those stop losses, pushes the stock above the range, then starts dumping all his shares.
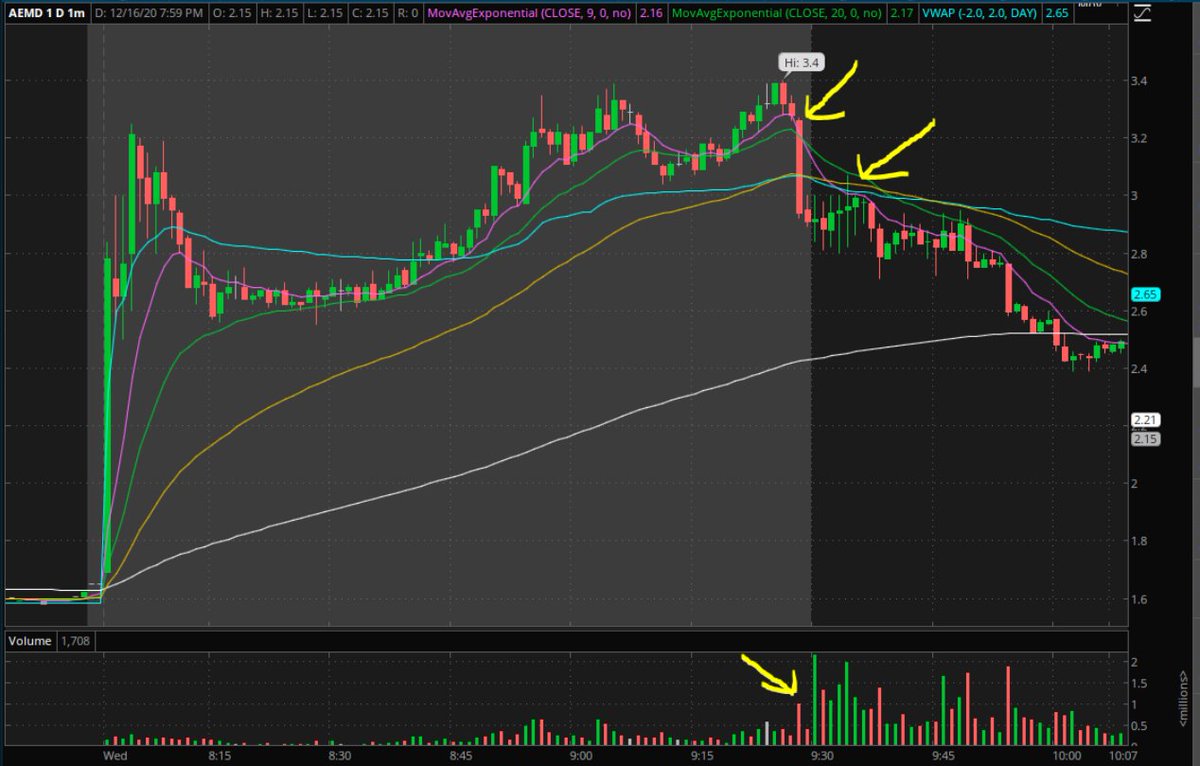
Pattern for $SPCB - the "big dump before market open" pattern.
How it works is super simple. The stock is strong all PM. Then right before market open (9:00am-9:29am) there is some HUGE dump candle that's the largest volume candle of the PM by far. Indicates seller is in control