Jeff Gilchrist Profile picture
Dec 10, 2022 27 tweets 9 min read Read on X
Toilets, wastewater COVID-19, RSV, and Influenza all increasing

This thread will be wastewater related, looking at new variants, levels, and what happens in the air after you flush that wastewater down the toilet with some cool video/graphics. 🧵1/ Image of aerosol plumes over a flushed toilet.
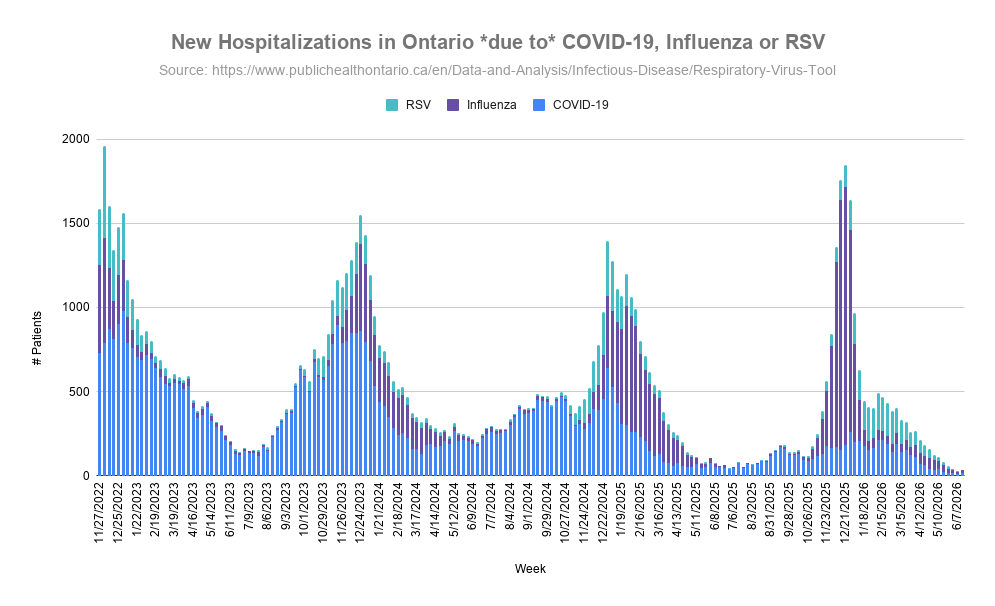
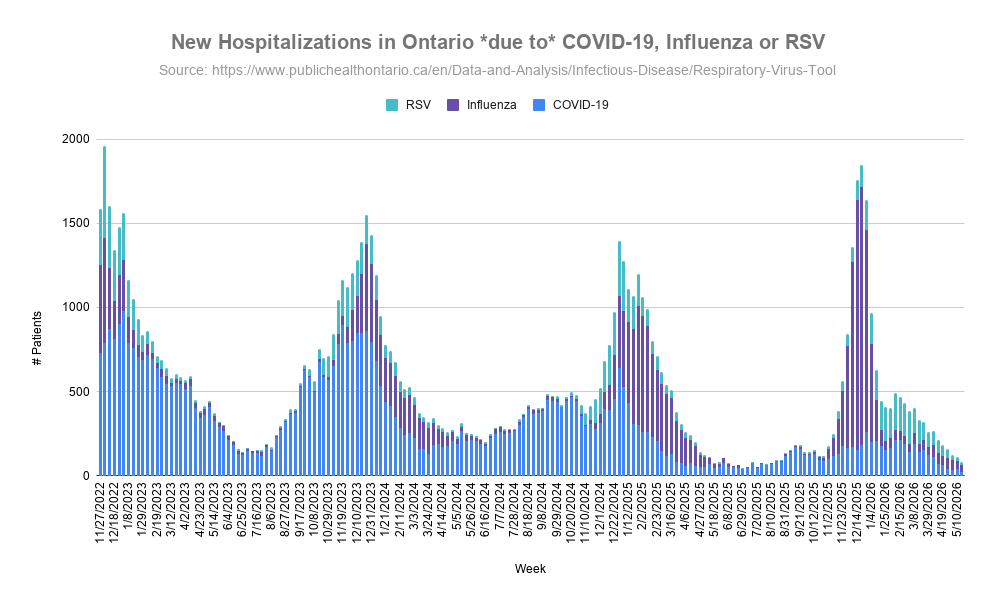
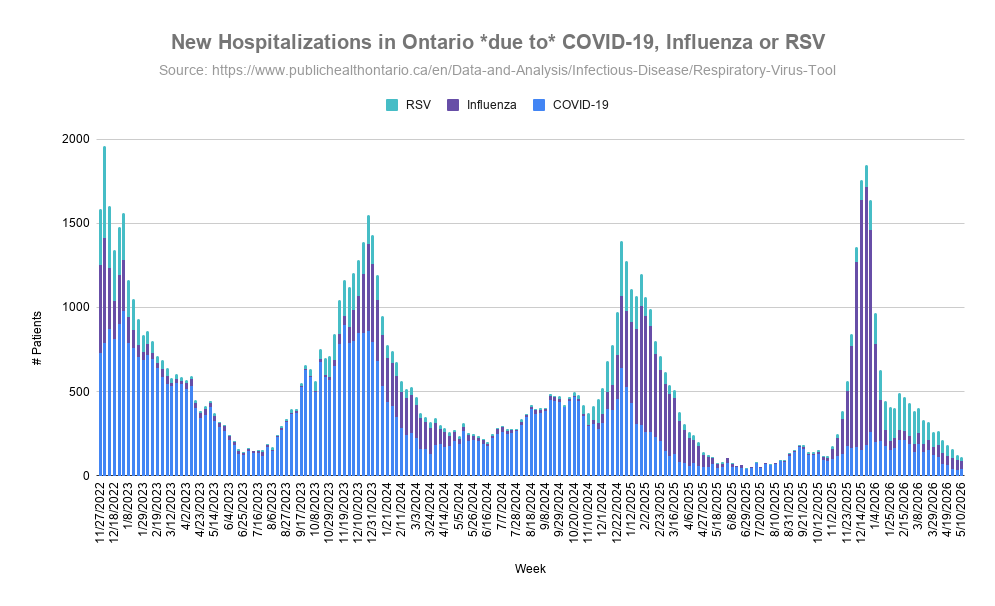
The wastewater levels in Ottawa, Canada are increasing for all measures ( ). RSV and Influenza A levels continue to increase which means even more pressure will be put on the hospitals that are already overwhelmed. 2/ covid.gilchrist.ca/Ottawa.html
Graphs showing increasing RSV and Influenza A wastewater levels in Ottawa, Canada
To make matters worse, COVID-19 levels have started increasing again. You can see in the graph that levels never actually returned to low levels but are on the rise again ( ). 3/ covid.gilchrist.ca/Ottawa.html
Graphs showing increasing COVID-19 wastewater levels in Ottawa, Canada
What might be making the difference now? New Omicron BQ based variants have rapidly been increasing in Ontario and as of 10 days ago already made up more than 40% of sequenced cases ( ). Graphs by @Mike_Honey_ 4/ app.powerbi.com/view?r=eyJrIjo…
Graph showing increasing levels of BQ.* variants in Ontario
The BQ.1 Typhon and BQ.1.1 Cerberus variants specifically have overtaken all the other circulating variants in Ontario and are much more immune evasive than previous variants. 5/ Graph showing increasing levels of BQ.1 and BQ.1.1 variants now dominant in Ontario
If wastewater levels are going up again it could be because more people are susceptible to this newer variant and is being more easily transmitted amongst people, even those that have been previously infected. 6/
Speaking of wastewater, a very cool study used lasers to actually see and measure the aerosol plumes that come out of toilets when you flush ( ). H/T: @yaneerbaryam 7/ nature.com/articles/s4159…
Image of aerosol plumes over a flushed toilet.
Aerosols can transmit infectious diseases including COVID-19, influenza and likely most respiratory viruses and even Strep bacteria has airborne spread ( ). H/T: @ELHopkins 8/thelancet.com/journals/lanmi…
When you flush a toilet, it releases plumes of tiny water aerosols into the air around you which can spread pathogens from human waste and expose people in public washrooms to contagious disease ( ). 9/ theconversation.com/toilets-spew-i…
Image of aerosol plume over a flushed toilet.
A typical commercial toilet generates a strong upward jet of air with velocities exceeding 2m/sec rapidly carrying particles up to 1.5m (5 feet) above the bowl within 8 seconds of the start of the flush which you can see in this video ( ). 10/
Toilet bowl water contaminated by feces can have pathogen concentrations that persist after dozens of flushes but it is still an open question as to how much of a transmission risk toilet aerosol plumes present. 11/
Particle size matters, the smaller aerosols can stay floating in the air for sometimes hours. Particles smaller than 5 microns can be breathed directly into your lower respiratory tract and those 6-12 microns can deposit in the upper airways ( ). 12/thelancet.com/journals/lanre…
The study measured a massive increase in particles smaller than 2.5 microns with most particles being less than 1 micron. 13/
Over the bowl (Loc 1 and 2 in diagram) particle counts increased more than 10x pre-flush rates and decreased afterwards, while 1.5m away from the bowl the particle count increase was lower but remained constant after flushing ( ). 14/ nature.com/articles/s4159…
Charts of aerosol particle size measurements from various locations.
While the visible aerosols in the video (5-10 microns) scatter more light from the lasers, they also captured the dimmer light scattered by smaller aerosols which found they move within the same envelope as the larger ones ( ). 15/ nature.com/articles/s4159…
Image showing small aerosol particles staying within plume with larger droplets fall quickly outside of plume.
Most interesting is they show large droplets follow ballistic trajectories, remain outside the aerosol plume envelope and drop quickly. Yet another blow to droplet theory being a significant contributor to transmission <darn laws of physics>. 16/
Closing the lid before flushing helps but does not completely eliminate plumes as there are still large gaps of space between the lid and the bowl when closed and many commercial toilets do not have lids at all. 17/
The researchers suggest that UV disinfection systems and better ventilation could help mitigate exposure to aerosol plumes in the bathroom. The next time you visit a public washroom, think of all the aerosolized human waste you are breathing in if you aren't wearing a mask... 18/
A lot of people have been saying to close the toilet lid first which doesn't stop the aerosols coming out and contaminates the underside of the lid that people touch as pointed out by this comment ( ). 19/
As @rnaguru points out, each pathogen is different, and so far studies haven't found much infectious COVID-19 particles in urine or feces so while the risk is not zero it may be very low. This may not be the case for other viruses/pathogens though ( ). 20/
But you will still want to wear your mask in public bathrooms to at least protect yourself from respiratory aerosols from the other people using the bathroom who may be infected (COVID, RSV, Influenza, etc...). 21/
It is not just breathing in aerosols released from flushing toilets that people need to worry about, but bacteria that gets deposited on your hands from hot-air hand dryers ( ). 22/ cnbc.com/2022/12/19/how…
Image showing person drying their hands using a hot air dryer in a bathroom
A study before the pandemic found that test plates exposed to bathroom air for 2 minutes with hand dryers off averaged < 1 bacteria colony while plates exposed to hand dryer air for 30 seconds averaged 18-60 colonies ( ). 23/journals.asm.org/doi/10.1128/AE…
When researchers swabbed the interior hand dryer nozzle, they found surfaces had minimal bacterial levels so they added HEPA filters to the hand dryers which reduced bacterial deposition by 4x. 24/
This implies the bacteria was coming from the bathroom air so just after washing your hands you get pathogens deposited on them right after again. 25/
Health experts recommended using paper towels to dry their hands instead and remind everyone that acquiring infection from direct contact with other people is much more likely than from drying your hands. 26/
This study found during contact tracing that someone got infected after using a shared bathroom 40 minutes after the index case left. A good example of it isn't just the people currently there in a public bathroom you need to worry about ( … ). 27/icjournal.org/DOIx.php?id=10…

• • •

Missing some Tweet in this thread? You can try to force a refresh
 

Keep Current with Jeff Gilchrist

Jeff Gilchrist Profile picture

Stay in touch and get notified when new unrolls are available from this author!

Read all threads

This Thread may be Removed Anytime!

PDF

Twitter may remove this content at anytime! Save it as PDF for later use!

Try unrolling a thread yourself!

how to unroll video
  1. Follow @ThreadReaderApp to mention us!

  2. From a Twitter thread mention us with a keyword "unroll"
@threadreaderapp unroll

Practice here first or read more on our help page!

More from @jeffgilchrist

Feb 10
#Ottawa, #Ontario, #Canada Virus Update:

You can see in the graph, COVID makes up the majority of new hospitalizations due to #Flu, #RSV or #COVID throughout the year, and even stays ahead during winter respiratory virus season. 🧵1/ A line graph displaying the percentage of patients hospitalized due to COVID-19, Influenza, or RSV over time, from September 1, 2023, to January 26, 2025. The x-axis represents weeks within this period, and the y-axis shows percentages from 0% to 100%. The graph has three colored lines: blue for COVID-19, purple for Influenza, and teal for RSV. The graph shows fluctuations in the percentage of hospitalizations due to each cause over time, with COVID-19 consistently having the highest percentage, followed by Influenza and RSV.
New hospitalizations are increasing again. This last update was the first time Flu hospitalizations (42) were significantly higher than COVID (34) in the same week with RSV at 14 people. 2/ The bar chart shows the number of new hospitalizations per week in Ottawa from August 27, 2023, to January 26, 2025. The y-axis represents the number of patients, ranging from 0 to 100. The x-axis represents the weeks. The bars are color-coded: blue for COVID-19, purple for Influenza, and teal for RSV. The chart shows fluctuations in hospitalizations over time, with notable peaks around December 2023 and January 2025.
In Ottawa, test positivity for Flu A (bright green) has really increased, COVID is still in second place, but seasonal human coronavirus is almost the same level, followed by Entero/Rhinovirus, and then RSV for the top 5. 3/ A stacked area chart displaying the percentage of positive tests for various viruses over time, from October 1, 2022, to January 26, 2025. The x-axis represents weeks within this period, while the y-axis represents the percentage, cumulatively stacked to 100%. The chart features the following viruses, each depicted in a distinct color: COVID-19 (red), Entero/Rhinovirus (yellow), Seasonal human coronavirus (purple), RSV (green), Parainfluenza (all types) (blue), Influenza B (dark purple), Influenza A (light green), Human metapneumovirus (pink), and Adenovirus (dark blue). The data shows fluc...
Read 6 tweets
Jan 20
Similar to #Canada, babies in the #UK are at higher risk for #hospitalization and #ICU admission from #COVID. Their data looks deeper at infants < 6 months old which have higher ER attendance, hospital admission and severe hospitalisation rates than the oldest adults 90+! 🧵1/
That data from the UK was taken from this pre-print study ( ). 2/medrxiv.org/content/10.110…
In Canada, babies < 1 years old had the highest ICU admission rates of all age groups from Aug. 27, 2023 to Aug. 24, 2024. Read on to see more details including Flu and RSV too ( ). 3/
Read 7 tweets
Jan 19
The @elastomaskpro () is a NIOSH approved reusable N95 elastomeric respirator. It is made of silicone so a higher chance it will fit and seal well and is super breathable at the same time. Read on to find out more about my experience with it. 🧵1/ elastomaskpro.comA blue respirator mask, called ElastoMaskPro, rests on top of a blue and white box. The mask has a smooth, curved design with two circular filters on each side. The mask's straps are neatly arranged.
A light blue ElastoMaskPro N95 reusable respirator mask with a soft, flexible facepiece rests on top of its packaging box. The mask features a large opening in the center, showcasing white pleated filters. Two elastic straps are attached to the mask for securing it to the face.
Full disclosure: ElastoMaskPro sent me a unit to evaluate. There were no strings attached, they just asked that I provided feedback after I tried it. This thread is the first time they are seeing my feedback, they did not review anything before it being posted here. 2/
The ElastoMaskPro is very cost effective at the current sale price of $29.99 which includes two N95 filtering pucks. You can continue using the filters until they either get too dirty or there is increased breathing resistance. 3/ ElastoMaskPro Filter Puck. Filter Pucks are constructed using an adhesive-free process that incorporates a large volume of long-lasting, highly durable mechanical filtration media.
Read 43 tweets
Jan 6
#Ottawa, #Ontario, #Canada Virus Update:

Ottawa updated its #respiratory #virus data again after a break for the holidays, respiratory related ED visits are up especially in kids 0-3, then 4-11 and age 80+. 🧵1/ A line graph showing the number of respiratory-related emergency department (ED) visits per 100,000 population by week, from September 1, 2023, to November 1, 2024, across different age groups. Six lines represent the age groups: Age 0-3 (purple), Age 4-11 (blue), Age 12-17 (green), Age 18-54 (yellow), Age 55-79 (red), and Age 80+ (orange). The Age 0-3 group shows the highest number of visits, peaking around 1000 visits per 100,000 population, while other age groups generally have rates below 250 visits per 100,000 population. The graph exhibits seasonal fluctuations, with peaks in the wint...
Quite a mixture of different viruses testing positive in the lab right now so people can pick up a variety of bugs in the air. 2/ A stacked area chart displaying the percentage of positive tests for various viruses over time, from October 1, 2022, to December 22, 2024. The x-axis represents weeks within this period, while the y-axis represents the percentage, cumulatively stacked to 100%. The chart features the following viruses, each depicted in a distinct color: COVID-19 (red), Entero/Rhinovirus (yellow), Seasonal human coronavirus (blue), RSV (green), Parainfluenza (purple), Influenza B (light blue), Influenza A (light green), Human metapneumovirus (pink), and Adenovirus (dark blue). COVID-19 maintains a high posit...
New hospitalizations also jumped a lot in the last two reporting weeks, not just due to #RSV but a big spike in #COVID as well.

Follow the latest updates here ( ). 3/ covid.gilchrist.ca/Ottawa.htmlThe bar chart shows the number of new hospitalizations per week in Ottawa from August 27, 2023, to December 22, 2024. The y-axis represents the number of patients, ranging from 0 to 100. The x-axis represents the weeks. The bars are color-coded: blue for COVID-19, purple for Influenza, and teal for RSV. The chart shows fluctuations in hospitalizations, with peaks around late 2023 and early 2024, and another peak towards the end of 2024.
A line graph displaying the percentage of patients hospitalized due to COVID-19, Influenza, or RSV over time, from September 1, 2023, to December 22, 2024. The x-axis represents weeks within this period, and the y-axis shows percentages from 0% to 100%. The graph has three colored lines: blue for COVID-19, purple for Influenza, and teal for RSV. COVID-19 consistently shows the highest percentage of hospitalizations, with fluctuations throughout the period.
Read 4 tweets
Dec 24, 2024
#Variant update for #Ontario, #Canada (to Dec 10, 2024)

The KP.3.1.1 #DeFLuQE variant has finally been surpassed with XEC now in top place above 20% while the other 5 (MC.* and XEC.* descendants) remain < 7%. Graph tools by @Mike_Honey_ 🧵1/ A line graph showing the lineage frequency of the top 7 COVID-19 genomes in Ontario, Canada, up to December 10, 2024. The graph includes data from 4,928 sequenced genomes. The x-axis represents dates from October 27 to December 08, while the y-axis represents lineage frequency percentages from 0% to 35%. Different colored lines represent different genome lineages: KP.3.1.1 (blue), MC.1 (green), MC.13 (purple), MC.16 (pink), MC.24 (orange), XEC (brown), and XEC.8 (yellow). Below the main graph, there is a bar chart showing the number of samples (n) collected each day, ranging from 0 to 200 s...
XEC is a combination of KP.3.3 and KS.1.1 that recombined together. MC.1 is a direct descendant of KP.3.1.1 with one spike mutation at T571I. To learn more about how variant naming works, you can read this article I wrote with @paulseaman31 ( ). 2/docs.google.com/document/d/1q0…
This Sankey graph shows the proportion of variants from PCR test genomic sequencing in Ontario since October 27, 2024. You can follow the lineage backwards to see where a variant is a descendant from. 3/ The Sankey diagram visually displays the evolution and distribution of sequenced genomes in Ontario, Canada, up to December 10, 2024. The diagram uses colored bars and curved lines to show the flow and relationships between different genome variants over time. Each variant is labeled, such as "XEC," "BA.2," "BA.2.86," "JN.1," "KP.3," and various sub-variants. These bars and lines illustrate the transitions and derivations from one variant to another. The total number of sequenced genomes depicted is 4,928. This visualization helps to underst...
Read 16 tweets
Dec 22, 2024
Population rate vs raw numbers

This is a good example of why it is useful to understand the importance of population *rate* and not just look at raw numbers. The first graph shows raw numbers and the second graph population rate. 🧵1/ #ED #Respiratory #Virus #Population #Ottawa Chart of Respiratory Related ED Visits by Week and Age (Ottawa, ON, Canada) with raw numbers
Chart of Respiratory Related ED Visits by Week and Age (Ottawa, ON, Canada) with population rate per 100K
Ottawa Public Health makes only the raw data available for All causes and respiratory-related emergency department visits to Ottawa hospitals by age group and week ( ). 2/open.ottawa.ca/datasets/ottaw…
If I take the data and plot all the ages together, you can at least see all of the age groups at the same time but it is just the raw numbers. 3/
Read 12 tweets

Did Thread Reader help you today?

Support us! We are indie developers!


This site is made by just two indie developers on a laptop doing marketing, support and development! Read more about the story.

Become a Premium Member ($3/month or $30/year) and get exclusive features!

Become Premium

Don't want to be a Premium member but still want to support us?

Make a small donation by buying us coffee ($5) or help with server cost ($10)

Donate via Paypal

Or Donate anonymously using crypto!

Ethereum

0xfe58350B80634f60Fa6Dc149a72b4DFbc17D341E copy

Bitcoin

3ATGMxNzCUFzxpMCHL5sWSt4DVtS8UqXpi copy

Thank you for your support!

Follow Us!

:(