The most important thing to know about the US data on foreign holdings of US Treasury securities is that the US doesn't really know who holds US Treasuries --
The biggest holders (after Japan and China) are ...
1/x
The biggest holders (after Japan and China) are ...
1/x
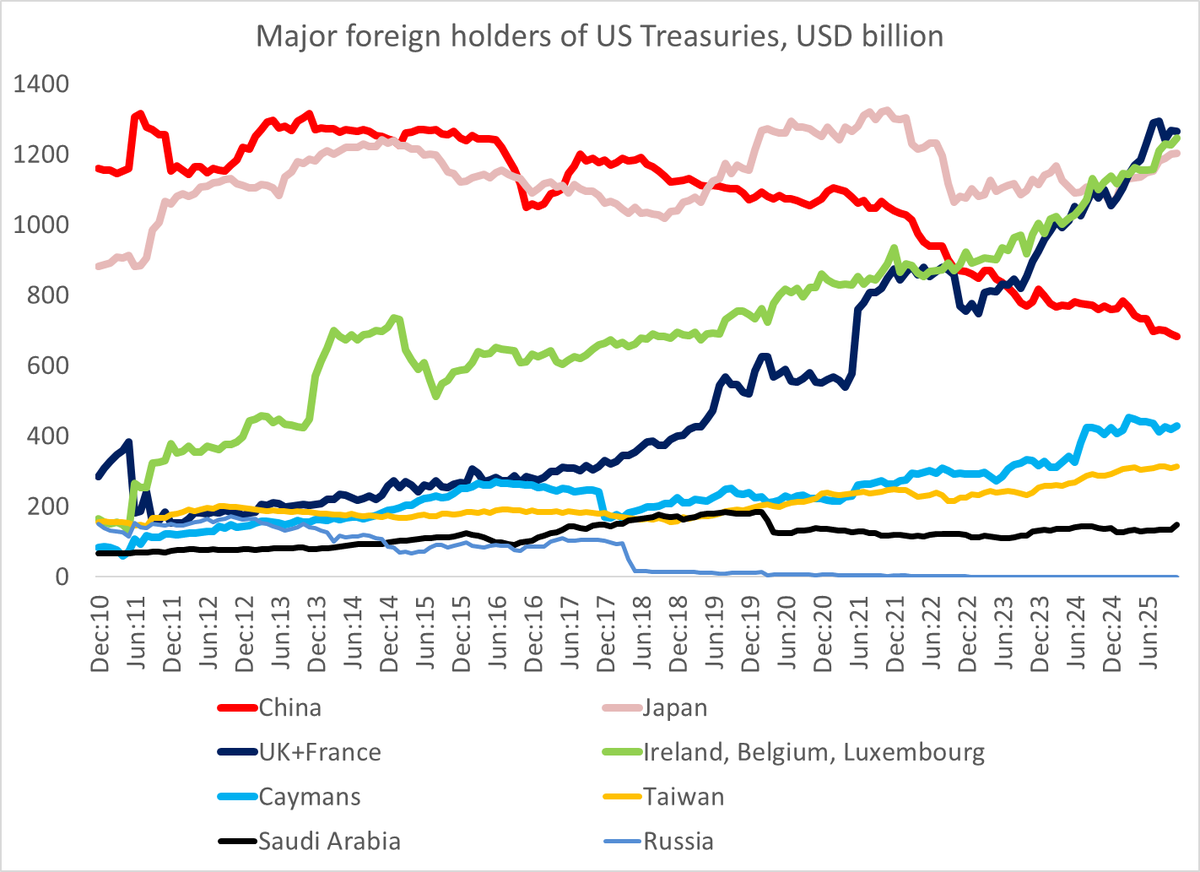
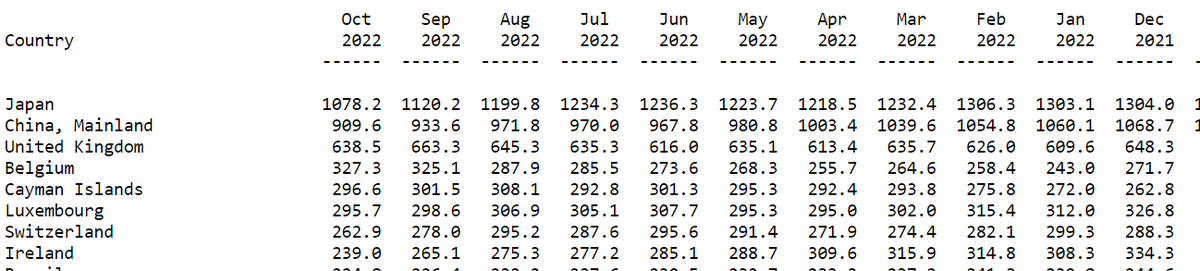
US Treasury holders, in rank order
Japan, China, the UK, Belgium, the Caymans, Luxembourg, Switzerland and Ireland
Only Japan and China (and to a degree Switzerland) are real holders, the rest are financial and custodial centers.
2/
Japan, China, the UK, Belgium, the Caymans, Luxembourg, Switzerland and Ireland
Only Japan and China (and to a degree Switzerland) are real holders, the rest are financial and custodial centers.
2/
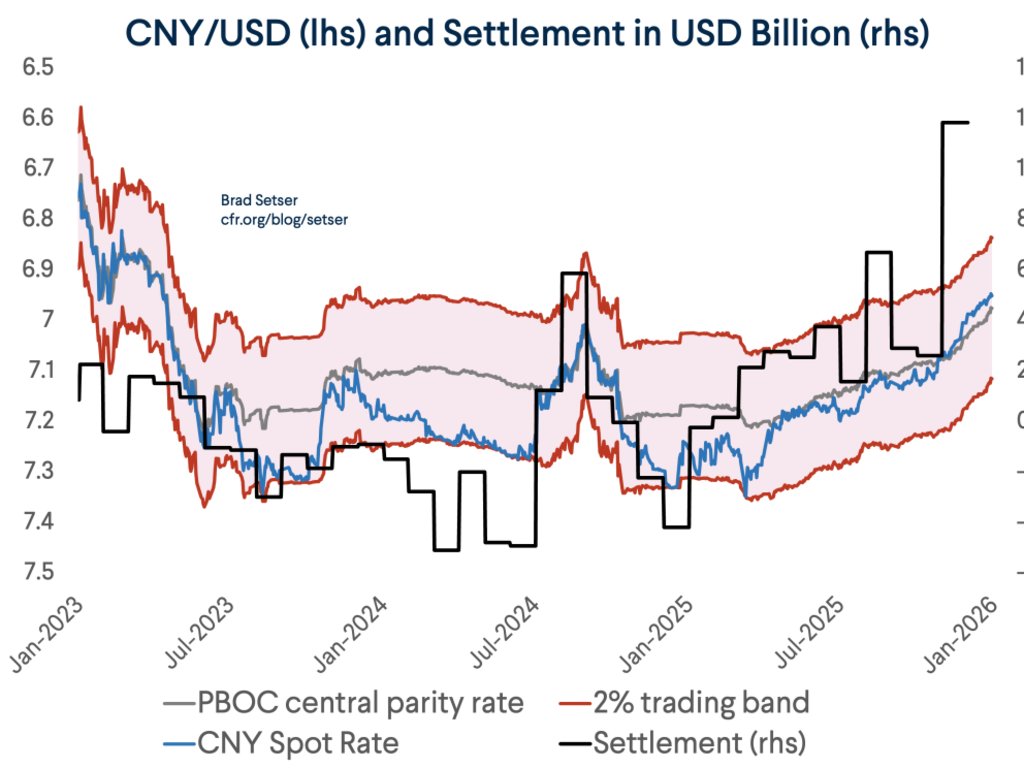
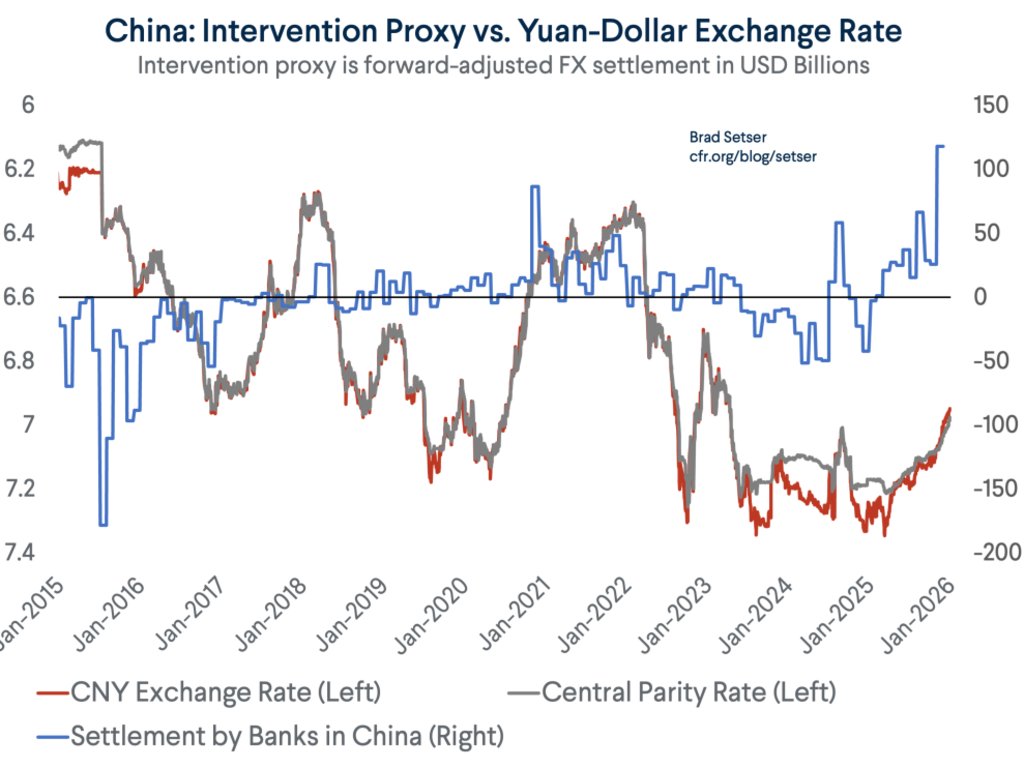
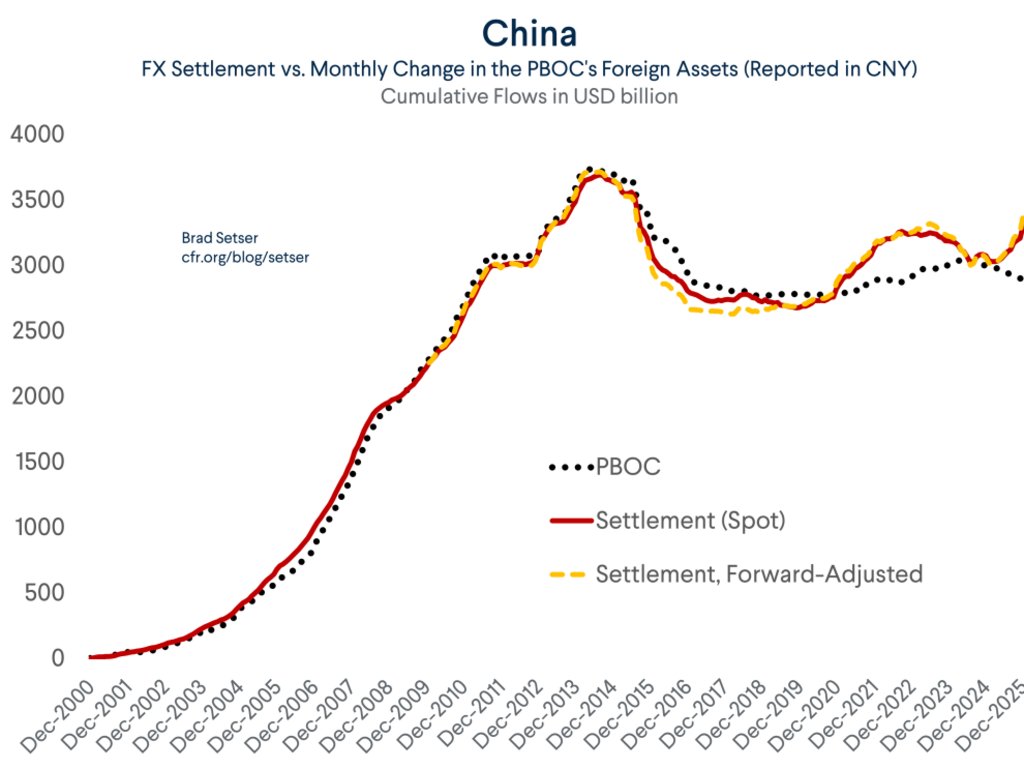
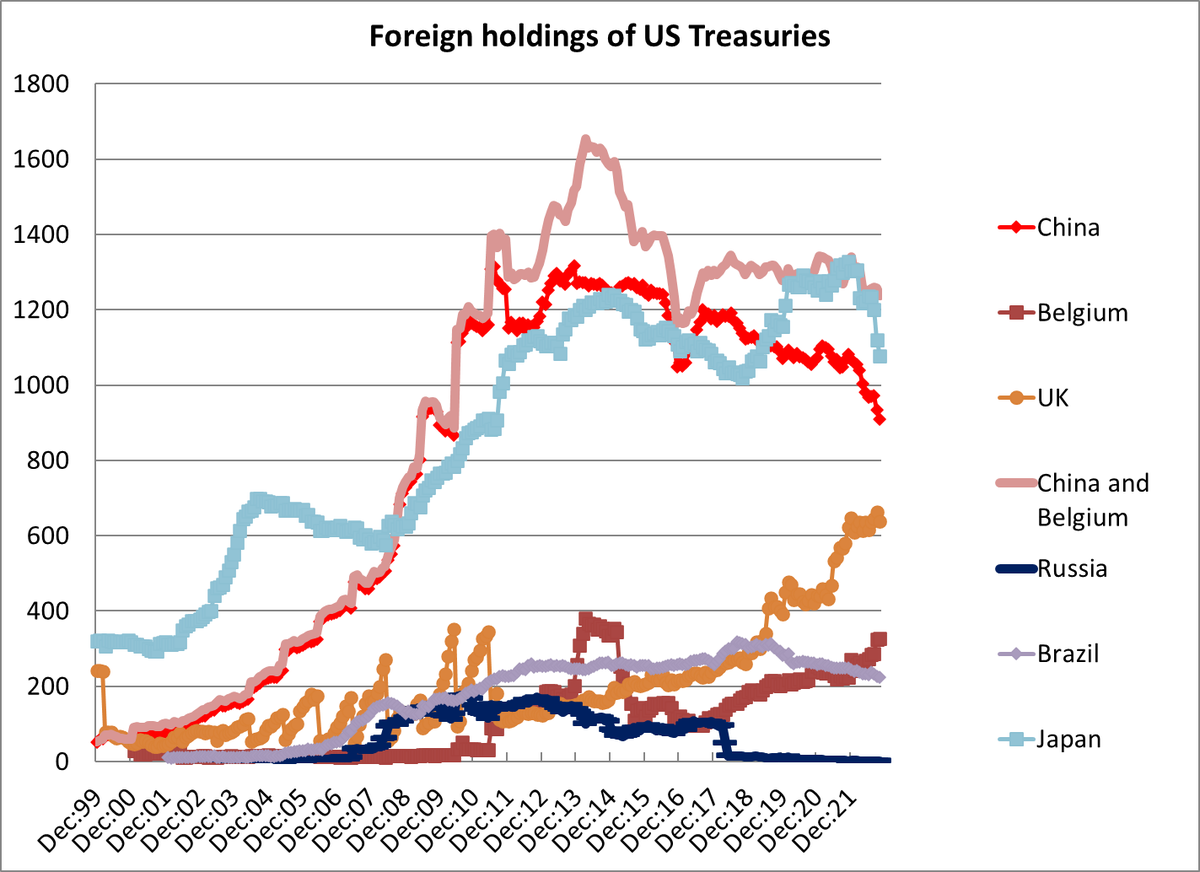
The second most important thing to know -- apart from the continued (apparent) purchases of Treasuries from private investors abroad (even if the buyers are the Caymans and the UK in the transactional data) -- is that China isn't selling ...
3/
3/

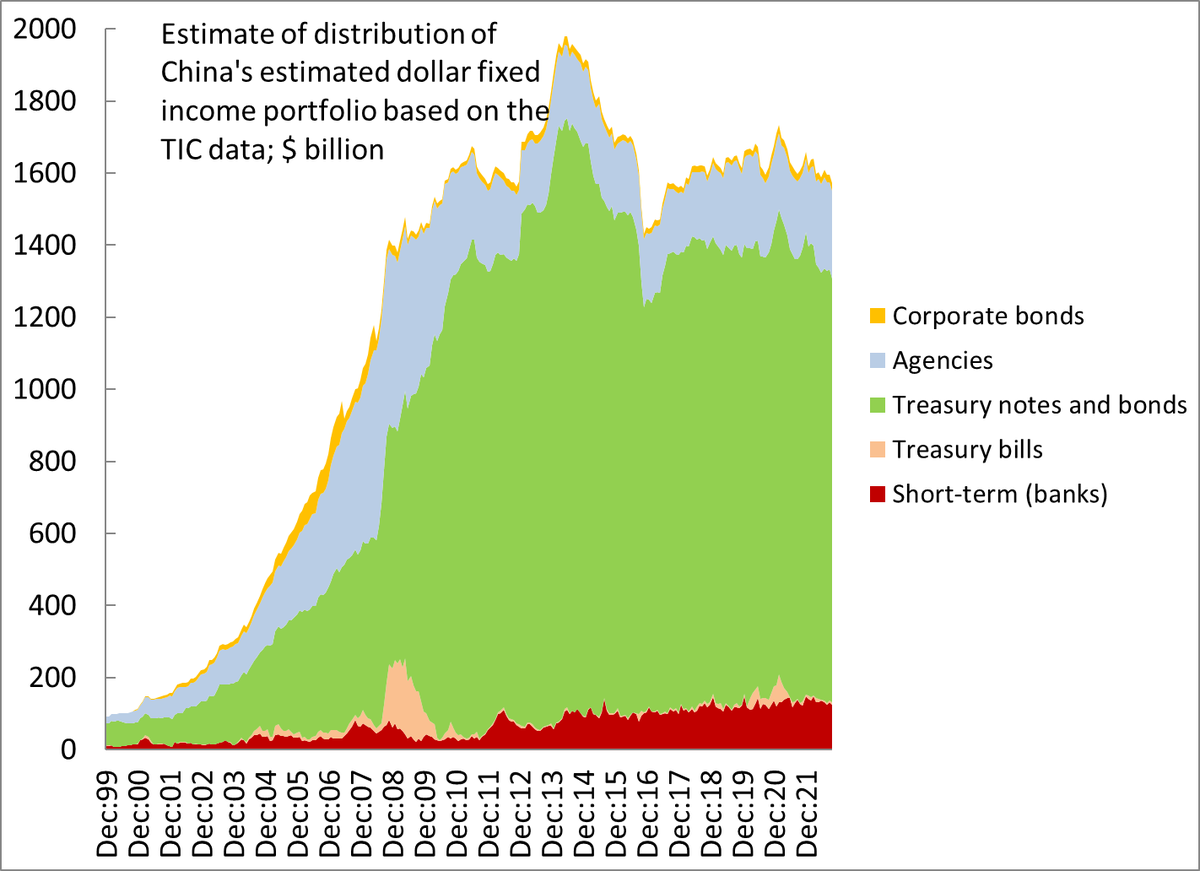
Neither the transactional data nor the custodial data fully capture China's activity.
But the transactional data showed Oct. purchases of Agencies and (surprisingly) Treasuries. The fall in the holdings data more or less disappears if you adjust for Agencies and Belgium
4/
But the transactional data showed Oct. purchases of Agencies and (surprisingly) Treasuries. The fall in the holdings data more or less disappears if you adjust for Agencies and Belgium
4/

It is in fact rather remarkable that after adjusting for the Belgian holdings (a euroclear account used by the PBOC it seems) China's fairly visible holdings of US bonds have stayed constant for the last 5ys (at ~ $1.6 trillion)
5/
5/
Japan's holdings of US securities are dropping like a rock -- a lot of it is valuation, so that will change with the November data tho.
But there is no doubt that the MoF sold in September and October (more in September it seems)
6/
But there is no doubt that the MoF sold in September and October (more in September it seems)
6/

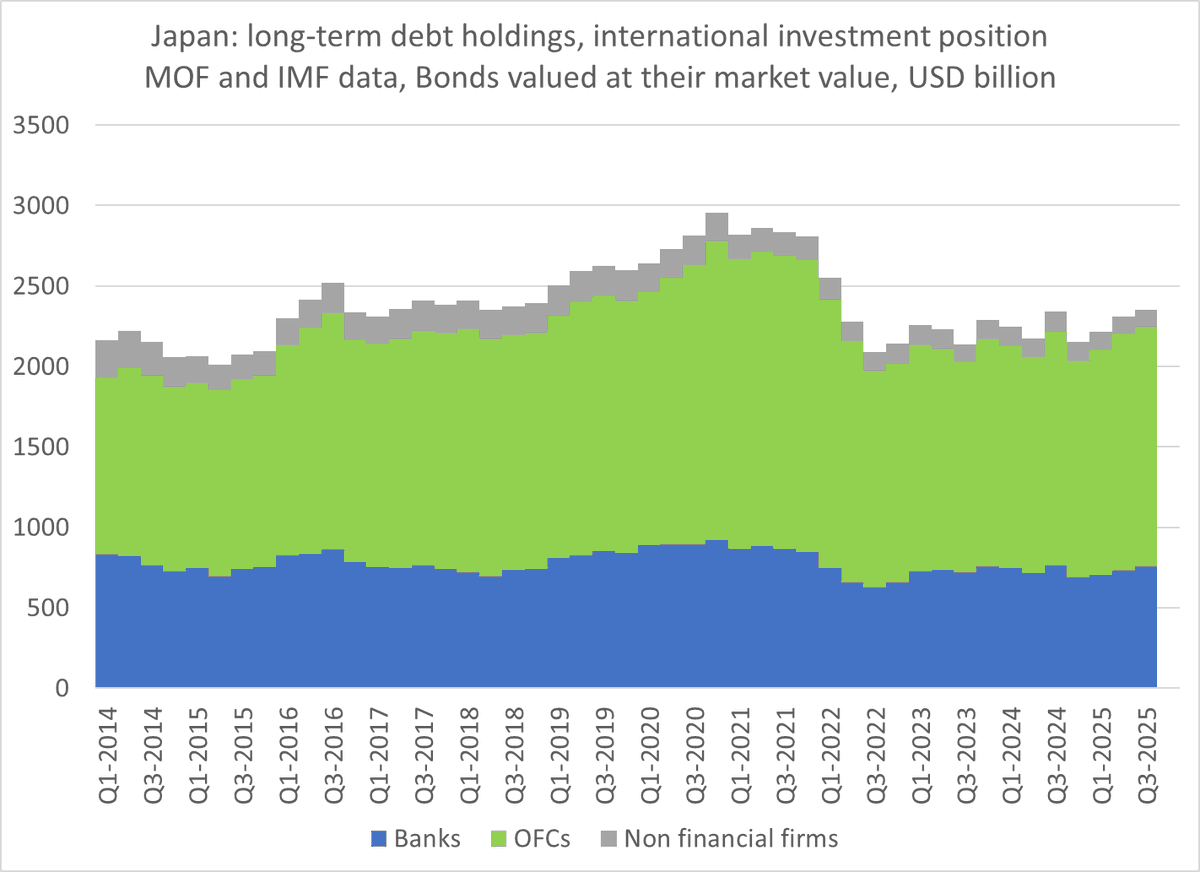
Japan reports the market value of the securities it holds in its reserves (as well as its actual intervention) and the US data shows the market value of Japan's holdings --
guess what, the changes recently have lined up nearly perfectly.
7/
guess what, the changes recently have lined up nearly perfectly.
7/

The flow (transactional) numbers for Japan tend to be fairly accurate (at least for the MoF) -- they show $24b in Treasury sales for Oct v $37-38b in September
8/
8/

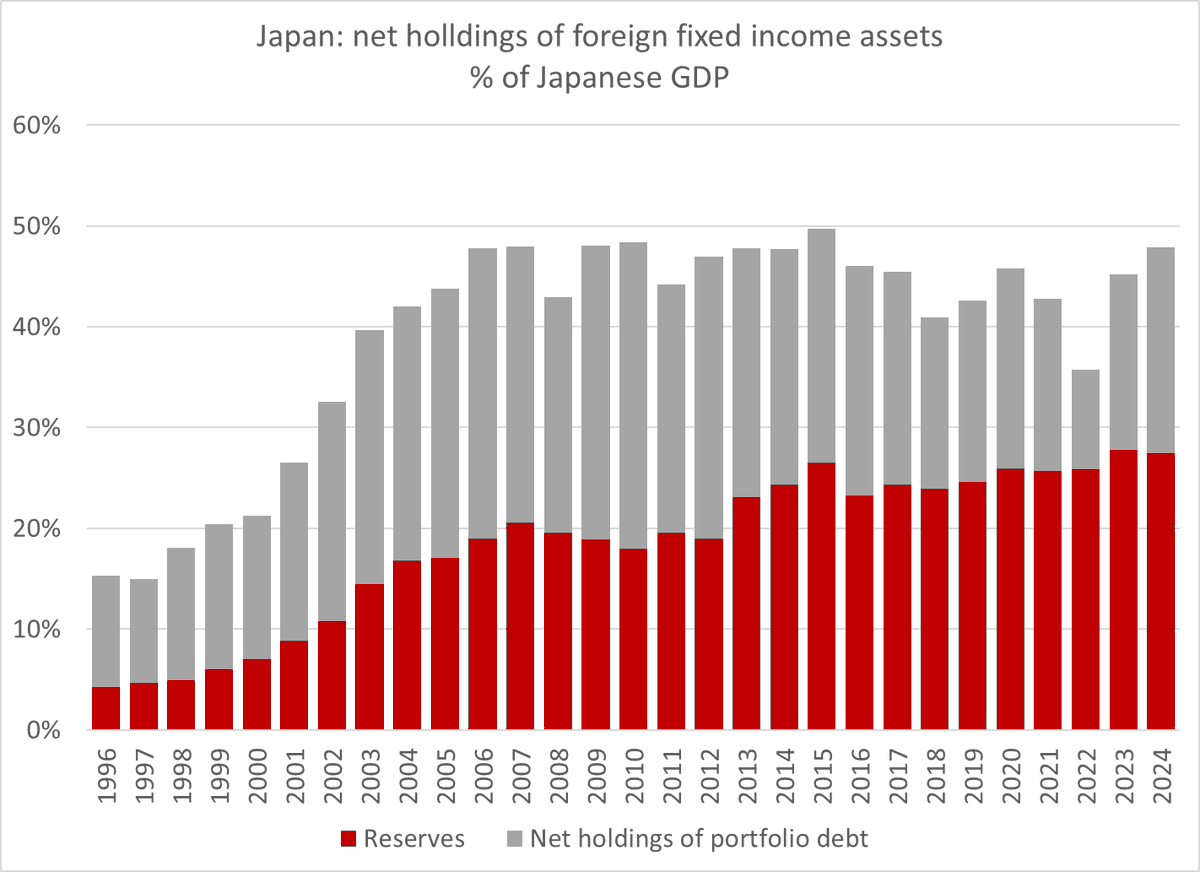
The TIC data tho doesn't tend to capture Japanese (or for that matter Taiwanese) holdings of US corporate bonds all that well tho, so it clearly has some important gaps -- Japanese private investors holds more US securities than show up in the custodial numbers for JP.
9/
9/
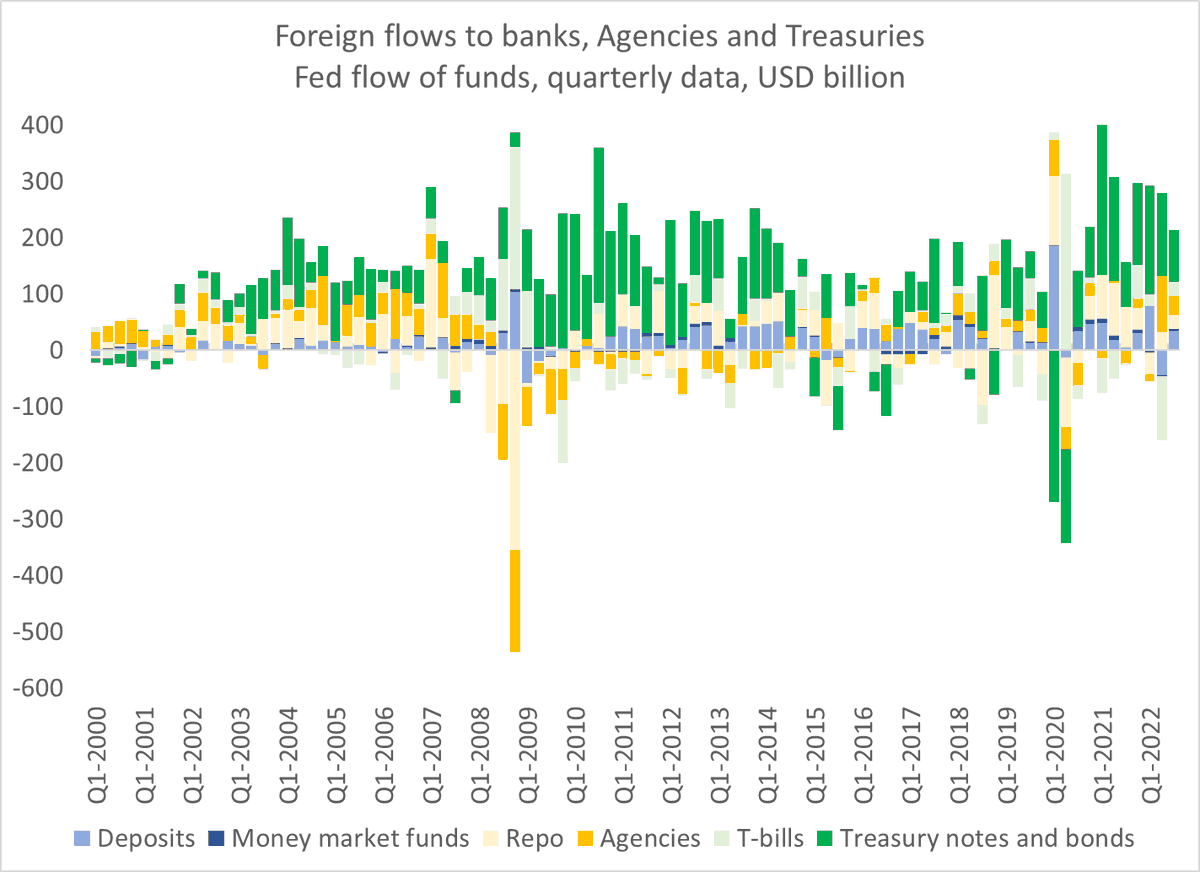
The October TIC data shows official sales of Treasuries, but ongoing private buying --
it is thus consistent with the flow of funds data for the year, which shows ongoing foreign purchases of Treasuries through q3 (even with China not buying and Japan selling)
10/
it is thus consistent with the flow of funds data for the year, which shows ongoing foreign purchases of Treasuries through q3 (even with China not buying and Japan selling)
10/
last note -- beware of any reports that just use the headline numbers for foreign holdings of Treasuries.
The holdings data is the most accurate part of the TIC data, but it really does need to be adjusted for valuation changes this year.
10/10
The holdings data is the most accurate part of the TIC data, but it really does need to be adjusted for valuation changes this year.
10/10
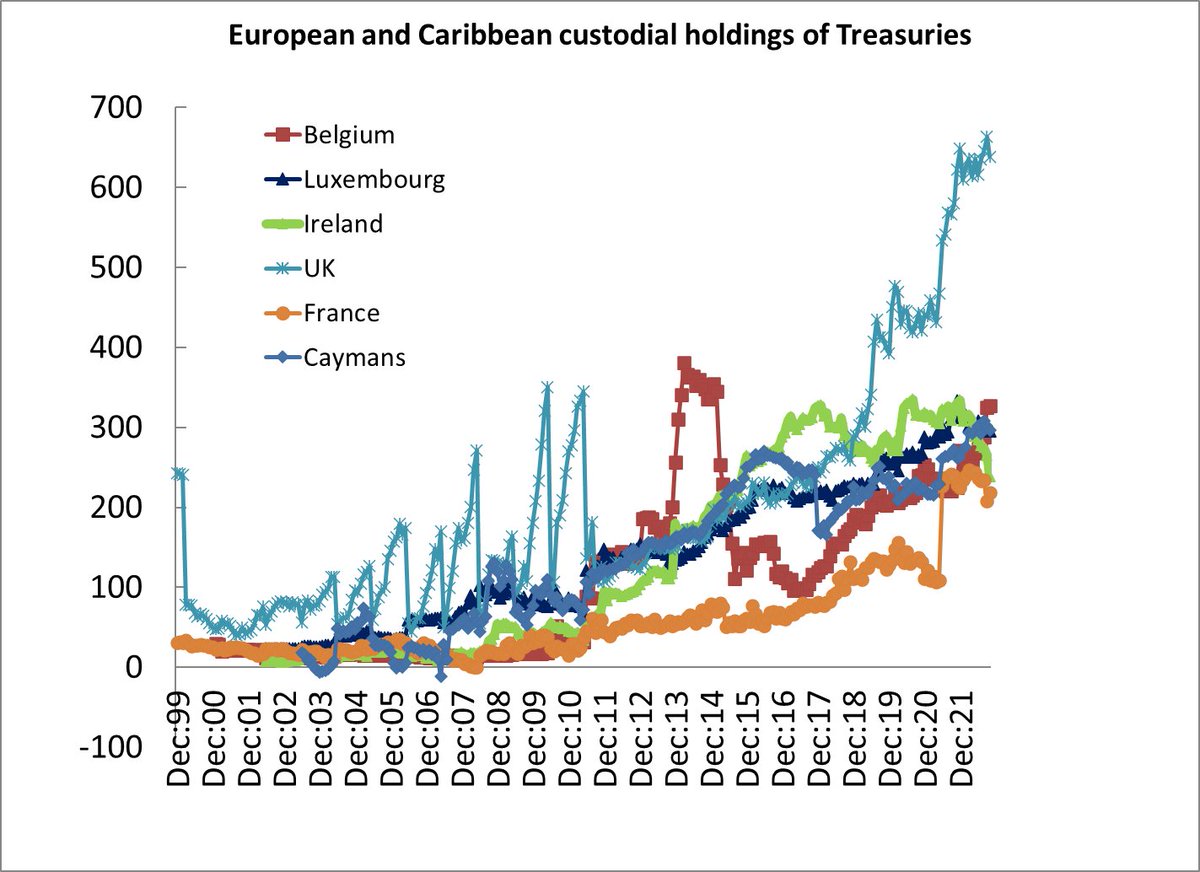
Bonus chart --
the big increases in foreign holdings recently have come from the UK, Belgium (likely China) and the Caymans ...
It is really hard to know who has been really buying abroad, tho someone has been.
the big increases in foreign holdings recently have come from the UK, Belgium (likely China) and the Caymans ...
It is really hard to know who has been really buying abroad, tho someone has been.
• • •
Missing some Tweet in this thread? You can try to
force a refresh