Here is my morning run down of the current market outlook using Dark Pools, Dealer Positioning and market wide Options Flow to inform our #optionstrading and #futurestrading today. Data can change but it will help formulate a plan.
Lets start with $SPX Gamma and Vanna courtesy of @WizOfOpsVol.land. The $SPX Vanna impact is minimal at these levels. Gamma is cluttered, with small amounts of support/resistance scattered in this zone. Could indicate more of a range day.
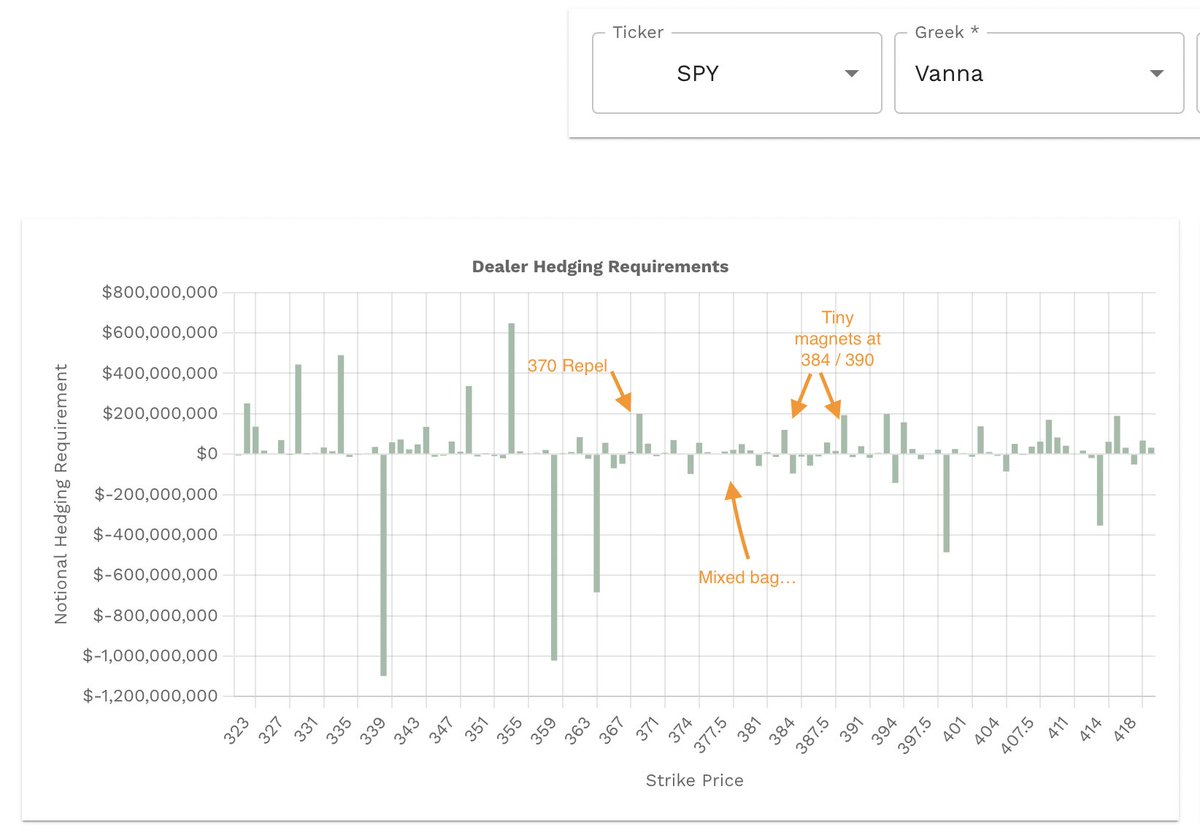
Now let's do the same for $SPY but add in some additional data points from @Tradytics data driven insights. Vanna/Gamma also a bit of a choppy mess. Scattered weak levels in this zone. The 3-day Deltas indicate highest probability of staying in a range.
@Tradytics Dark Pools help paint the the picture further. Lower DP volume and mixed sentiment help indicate a potential fixed range as well.
Now, take a look at 5-day market net flow and delta positioning across the market. Puts continue to accumulate, most likely for downside protection. Market wide deltas remain bearish, however negative deltas have diminished slightly.
Lastly, we need to make sure we keep all the upcoming macro number releases in mind as they are the big fundamental drivers of the market. We have jobless claims tomorrow but the big one is PCE on Friday. This may indicate why there is a lack of participation.
I find that CPI gets more attention than PCE when it comes to macro numbers, however PCE is very important and pertains to businesses. Worth a read if you're unfamiliar.
With PCE on Friday and the dealer/dark pool structure looking like this, I wouldn't be surprised to see consolidation within $SPY $380 - $390 until Friday. These times can be the trickiest to trade.
On $ES, I'm looking to make my money within the first couple hours. Would love to see a retest of Asia/London highs, however if we don't get it, will look for new opportunities.
If you are interested in viewing & using this data plus more with hundreds of other assets, use coupon code FattyTrades for discounts with Vol.land, Tradytics, Sonarlabs indicators & Elite Trader Fund funded futures accounts!
• • •
Missing some Tweet in this thread? You can try to
force a refresh
The question on your mind is how do I know when to get in? It's a 20 point range including the FVG & OB so we don't just want to buy immediately, we need confirmation. For overnight confirmations on $NQ I prefer the 1m time frame. We close in and the FVG clears quickly.
Despite the move down, we see price begin to slowdown. This is our first queue to be ready. Now we need a confirmation candle. This can include bull hammers, engulfing, pin bars, etc. Ideally, we want to see a big increase in volume with price action confirmation.
Here is my morning run down of the current market outlook using Dark Pools, Dealer Positioning and market wide Options Flow to inform our #optionstrading and #futurestrading today. Data can change but it will help formulate a plan.
Lets start with $SPX Gamma and Vanna courtesy of @WizOfOpsVol.land. The $SPX dealer involvement is still very light. See screenshots for small impacts various Vanna/Gamma levels will have.
Now let's do the same for $SPY but add in some additional data points from @Tradytics data driven insights. Vanna/Gamma also very light. See screenshots for small impacts. The delta correlations indicate range. The 15-day delta momentum flipped bearish (-0.05679).
I find it super interesting how often dealer data correlates with price action. Based on the way deltas are currently structured on $SPY, historically we've seen up to a 2.8% drop in price over the next 5 days with extreme volatility. This puts right into a major OB on the Daily.
In this instance, I'm using the @Tradytics Dealer Positioning dashboard and viewing deltas, which correlates current dealer side positioning with $SPY moves going back to 6/2021. It's one of the easiest, most effect ways to view the impact delta structure has had historically.
I find it refreshing how it uses statistical data and reflects everything in probabilities. I always pair it with other data, but tonight I just wanted to see how it paired with the chart. It always lines up with key areas & gives extra meaning behind the likely "buy zones".
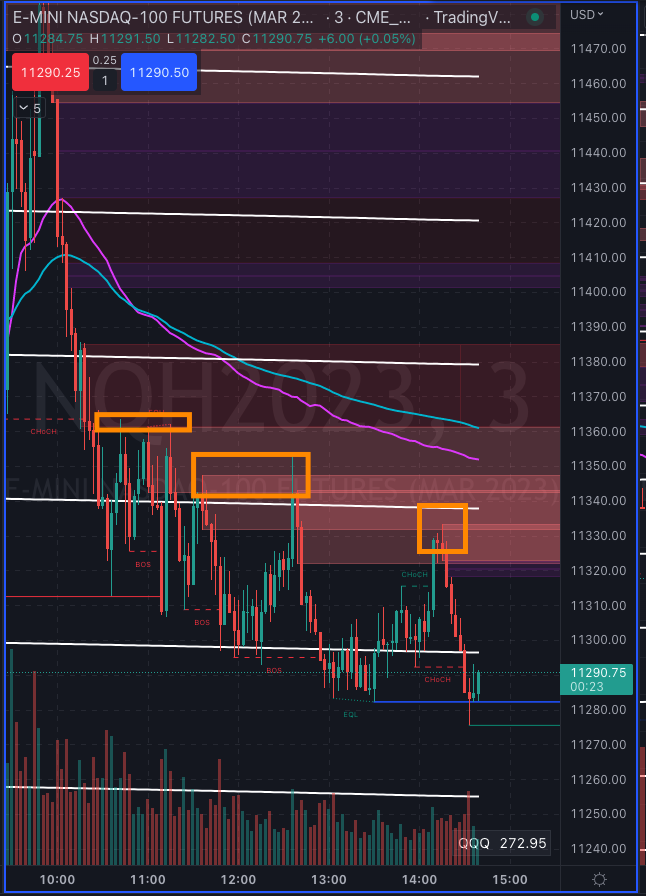
I haven't see anything yet that makes me feel good about longs since the open. Just constant hard rejections out of OB after OB on $NQ 3m. Just be careful if you're going for a DMD play. Do not force it. Do not ignore price action.
Okay looking like I might try some longs if I can find a good entry but I'm going to be cautious around bearish OB's. Not going to assume they break, just take profits when we approach.
Okay out on ES, looking to reload if we get signs of buy up
Here is my morning run down of the current market outlook using Dark Pools, Dealer Positioning and market wide Options Flow to inform our #optionstrading and #futurestrading today. Data can change but it will help formulate a plan.
Lets start with $SPX Gamma and Vanna courtesy of @WizOfOpsVol.land. The $SPX Vanna picture has changed dramatically with only having repellents at the extremes! Same with Gamma, we have areas of positive gamma above & below that can be S/R but it's minimal!
Now let's do the same for $SPY but add in some additional data points from @Tradytics data driven insights. Vanna impact similar to $SPX. Gamma shows support @ $384/$388 & resistance @ $393/$396, with accelerants in between. The 5-day delta correlations favor the bears!
With @Tradytics Dealers Market Diary (DMD) on many minds for tomorrows OPEX event, lets talk about how it played out on 11/18/22 $ES (works for $SPY / $SPX / $NQ / $QQQ / $YM / $DIA / $IWM / $RTY as well) to get an idea of how we can execute tomorrow!
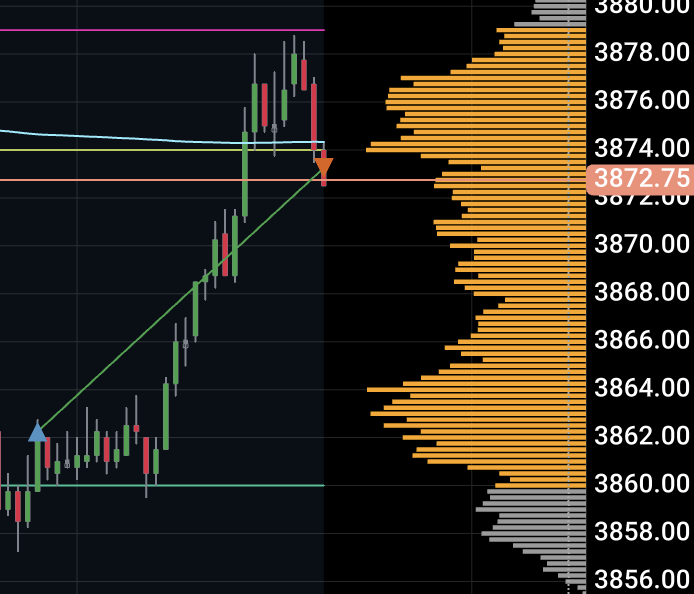
The London session printed its low @ 3943.50. The NY open created two notable bearish OB's and consumed liquidity from London bull move on its way down (note - referencing 3m chart).
The DMD looked similar to the way it looks for 12/16. It wasn't as heavily skewed with negative deltas but was still notable, so we were expecting a bullish reversal EoD. The question is when & where?