
How to Draw
Support , Resistance and Trendlines ?
A Foundation of Stock Market !
A Thread 🧵
Retweet and Share :)
Support , Resistance and Trendlines ?
A Foundation of Stock Market !
A Thread 🧵
Retweet and Share :)
What is Support and Resistance ?
⏫Support is an area for price , where it halts due to demand of the stock at that price .
⏬Resistance is an area for price ,where it halts due to Supply of the stock at that price .
1/n
⏫Support is an area for price , where it halts due to demand of the stock at that price .
⏬Resistance is an area for price ,where it halts due to Supply of the stock at that price .
1/n

How to Draw S/R ?
You can use Any time frame for Drawing S/R and it works on all time frames .
Whenever the Price Reverses from an area for more than 2 times that area can be called as S/R .
You can use Line Tool Or Rectangle tool to plot this on charts .
2/n
You can use Any time frame for Drawing S/R and it works on all time frames .
Whenever the Price Reverses from an area for more than 2 times that area can be called as S/R .
You can use Line Tool Or Rectangle tool to plot this on charts .
2/n

Types of Support Resistance
1. Horizontal
2. Moving Averages
3. Trendline
4. Psychological Numbers (100 , 200 etc)
3/n
1. Horizontal
2. Moving Averages
3. Trendline
4. Psychological Numbers (100 , 200 etc)
3/n
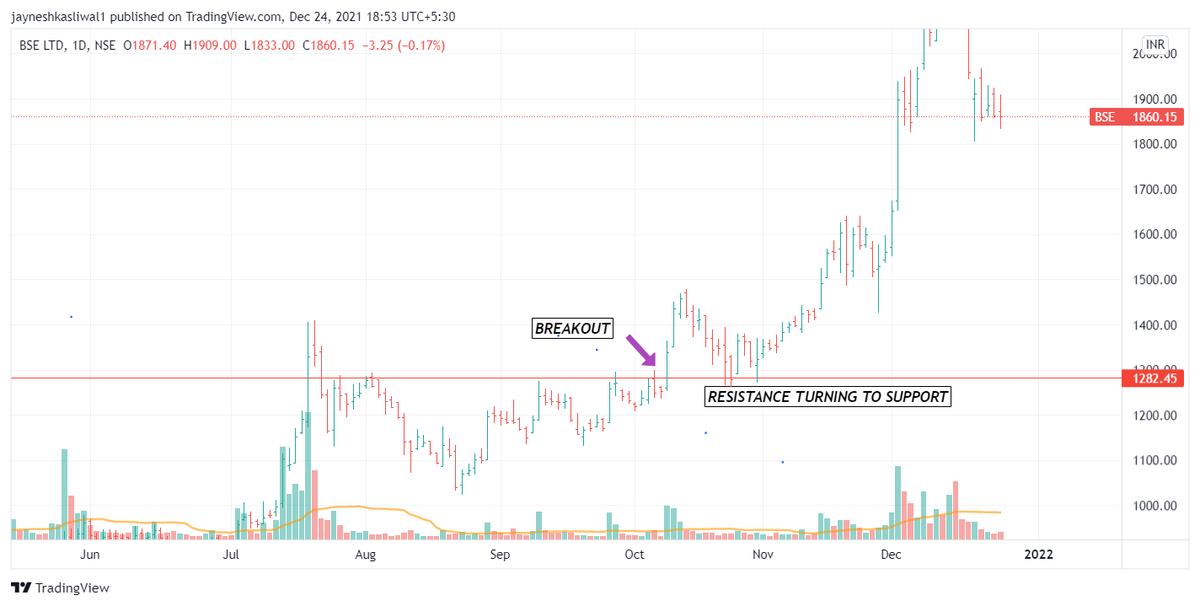
Reversal of Polarity .
Whenever Resistance Breaks , it tends to act as support and Whenever support breaks it tends to act as resistance
4/n
Whenever Resistance Breaks , it tends to act as support and Whenever support breaks it tends to act as resistance
4/n


What is Breakout/ Breakdown ?
✅Whenever Resistance Breaks , it is know as BREAKOUT.
✅Whenever Support Breaks , it is know as BREAKDOWN.
🛑One should check all other parameters like , Volume , relative Strength etc while trading these.
5/n
✅Whenever Resistance Breaks , it is know as BREAKOUT.
✅Whenever Support Breaks , it is know as BREAKDOWN.
🛑One should check all other parameters like , Volume , relative Strength etc while trading these.
5/n
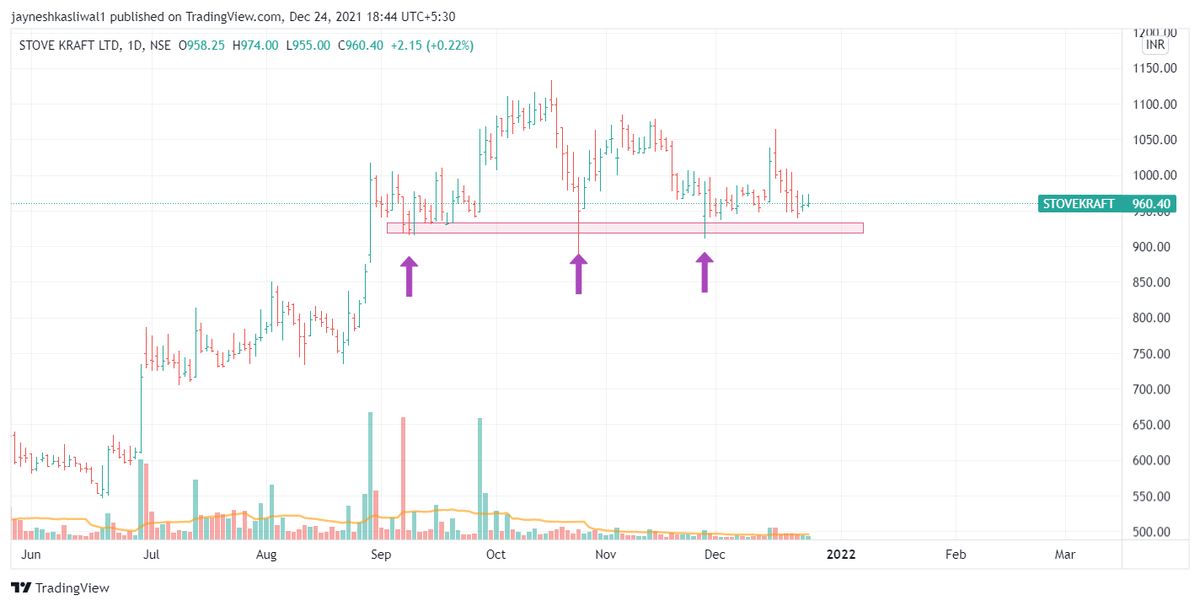
BREAKOUT/BREAKDOWN FAILURES:
Sometimes the Support Will also break and , Resistance will not Act support .
These Scenarios cant be avoided by anyone :)
6/n
Sometimes the Support Will also break and , Resistance will not Act support .
These Scenarios cant be avoided by anyone :)
6/n


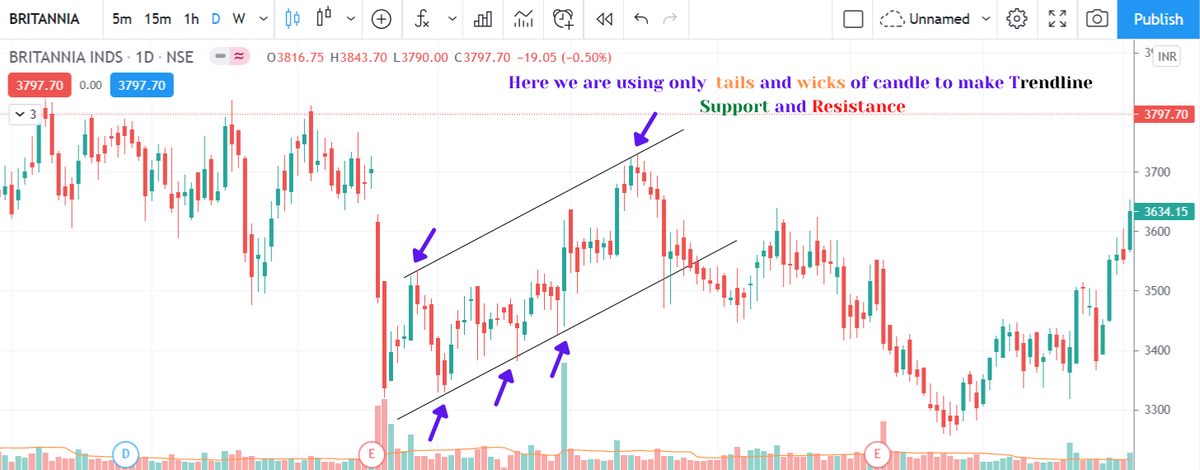
Trendline :
Confused between connecting wicks or bodies while drawing a trendline ?
Our main aim to draw trendline is to get maximum points of price on a line .
It can be through wicks tails or body and there is no fixed rule !
7/n
Confused between connecting wicks or bodies while drawing a trendline ?
Our main aim to draw trendline is to get maximum points of price on a line .
It can be through wicks tails or body and there is no fixed rule !
7/n


Trendline as Trailing Stop Loss.
1. Trending stock Tends to pullback near Moving averages and trendlines .
2. This could be areas of fresh buying or you can shift your Stop loss to upside
3. As soon as trendline is broken then you can sell a stock and take reverse position
8/n
1. Trending stock Tends to pullback near Moving averages and trendlines .
2. This could be areas of fresh buying or you can shift your Stop loss to upside
3. As soon as trendline is broken then you can sell a stock and take reverse position
8/n


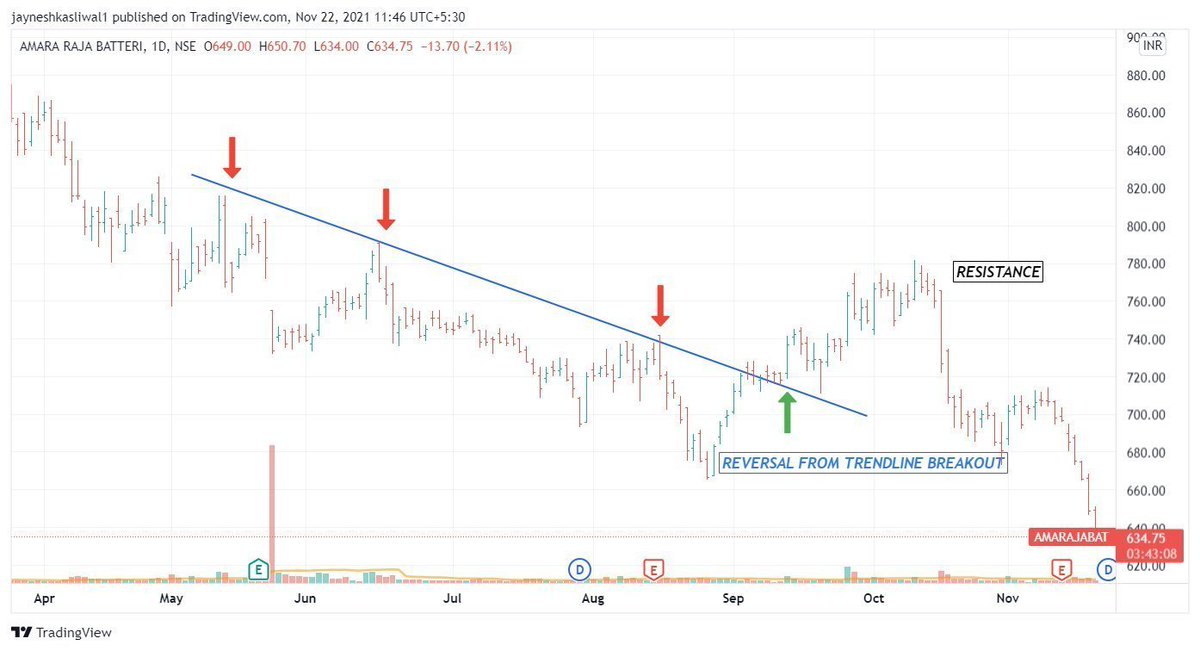
Trendline as Trendreversal
1. You can Buy breakouts of trendline in a downtrend
once the trend is changed with emergence of HH HL structure
2. You can initiate long postion with Stop at previous swing low
3. Sometimes you may find retest on trendline also
9/n
1. You can Buy breakouts of trendline in a downtrend
once the trend is changed with emergence of HH HL structure
2. You can initiate long postion with Stop at previous swing low
3. Sometimes you may find retest on trendline also
9/n

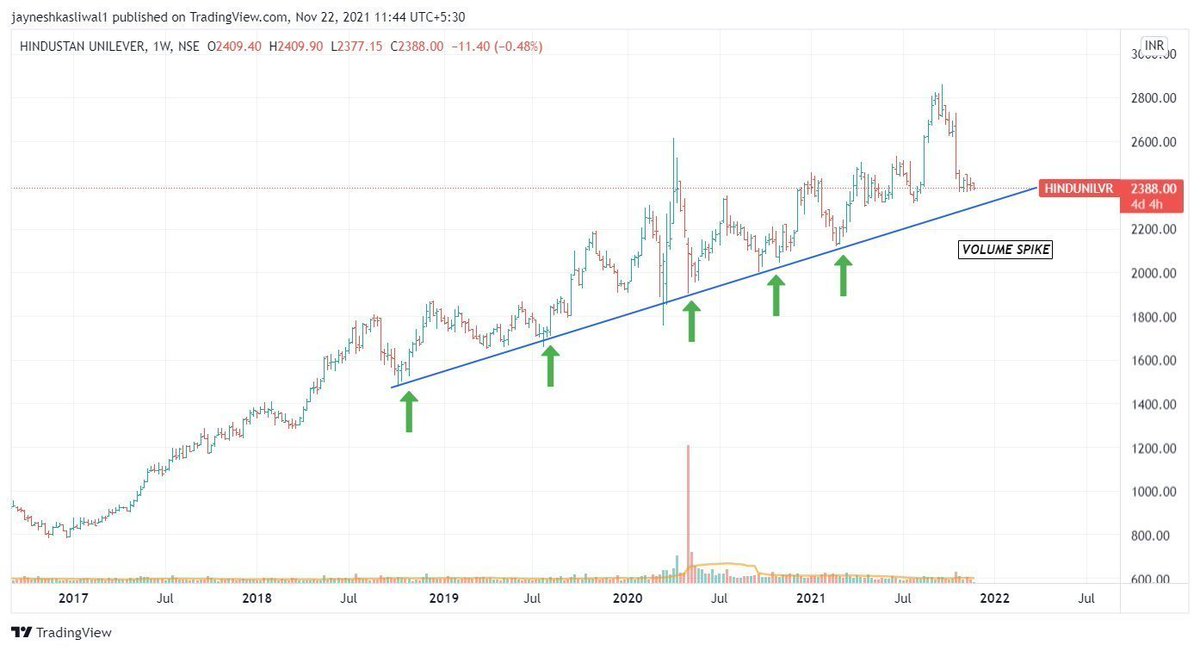
Trendline will act as Support and Resistance
Simple Strategy of Buy Low Sell High works best combined with other buying rules
10/n : End
Simple Strategy of Buy Low Sell High works best combined with other buying rules
10/n : End


𝙎𝙬𝙞𝙣𝙜 𝙏𝙧𝙖𝙙𝙞𝙣𝙜 𝙈𝙚𝙣𝙩𝙤𝙧𝙨𝙝𝙞𝙥
To learn more about " How to Pick Stocks For 50-100% Returns "
Join our 4 Week Mentorship program with upto 10 Hours of Live Sessions !
Payment Link : rpy.club/g/rhZQwO97TG
You will be sent joining link to your WhatsApp
To learn more about " How to Pick Stocks For 50-100% Returns "
Join our 4 Week Mentorship program with upto 10 Hours of Live Sessions !
Payment Link : rpy.club/g/rhZQwO97TG
You will be sent joining link to your WhatsApp
Mentoship Program Feedback :
What Mentees have to say : #𝗙𝗲𝗲𝗱𝗯𝗮𝗰𝗸
LINK FOR ENQUIRY: wa.link/si4jn4
Payment Link : rpy.club/g/rhZQwO97TG
What Mentees have to say : #𝗙𝗲𝗲𝗱𝗯𝗮𝗰𝗸
LINK FOR ENQUIRY: wa.link/si4jn4
Payment Link : rpy.club/g/rhZQwO97TG


Join Telegram for Updates :
t.me/Techno_charts
t.me/Techno_charts
• • •
Missing some Tweet in this thread? You can try to
force a refresh


