
𝗡𝗶𝗳𝘁𝘆-𝗕𝗮𝗻𝗸𝗻𝗶𝗳𝘁𝘆 𝗢𝗽𝘁𝗶𝗼𝗻 𝗕𝘂𝘆𝗶𝗻𝗴 𝗦𝘁𝗿𝗮𝘁𝗲𝗴𝘆
Complete Backtest and Indicator link
🧵 A Thread 🧵
Complete Backtest and Indicator link
🧵 A Thread 🧵
𝗦𝗲𝘁𝘂𝗽:
🔸 Monthly Option Buying
🔸 50 ema on 3 min timeframe
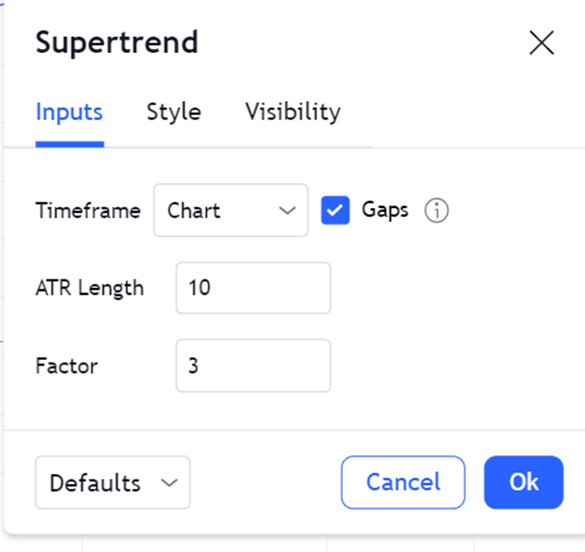
🔸 Supertrend 10 , 3
🔸 Chart : Banknifty , Nifty Futures as we backtested on futures
🔸 Entry 9:20 to 3:00
🔸 Max 3 Entries per day
🔸 Premium nearest to 200 Rs only
[2/18]
🔸 Monthly Option Buying
🔸 50 ema on 3 min timeframe
🔸 Supertrend 10 , 3
🔸 Chart : Banknifty , Nifty Futures as we backtested on futures
🔸 Entry 9:20 to 3:00
🔸 Max 3 Entries per day
🔸 Premium nearest to 200 Rs only
[2/18]
Why Monthly Option buying ?
🔸 Less theta decay compared to weekly options
🔸 Less Volatility
🔸 Supertrend and MA Settings
[3/18]
🔸 Less theta decay compared to weekly options
🔸 Less Volatility
🔸 Supertrend and MA Settings
[3/18]

🔸 Indicator Link
🔸 Click on the below 𝘭𝘪𝘯𝘬 -> 𝘈𝘥𝘥 𝘵𝘰 𝘍𝘢𝘷𝘰𝘶𝘳𝘪𝘵𝘦𝘴 -> 𝘈𝘥𝘥 𝘰𝘯 𝘊𝘩𝘢𝘳𝘵 from favourites and start using it !
🔸 in.tradingview.com/script/B11r9V4…
[4/18]
🔸 Click on the below 𝘭𝘪𝘯𝘬 -> 𝘈𝘥𝘥 𝘵𝘰 𝘍𝘢𝘷𝘰𝘶𝘳𝘪𝘵𝘦𝘴 -> 𝘈𝘥𝘥 𝘰𝘯 𝘊𝘩𝘢𝘳𝘵 from favourites and start using it !
🔸 in.tradingview.com/script/B11r9V4…
[4/18]
𝗜𝗻𝗱𝗶𝗰𝗮𝘁𝗼𝗿 𝗦𝗲𝘁𝘁𝗶𝗻𝗴𝘀 :
🔸 Max 6 Trades per day ( Both CE and PE buy)
🔸 Timings 9:20 am to 3:00 pm
🔸 Supertrend : 10,3
🔸 Moving Average 50 ema
[5/18]
🔸 Max 6 Trades per day ( Both CE and PE buy)
🔸 Timings 9:20 am to 3:00 pm
🔸 Supertrend : 10,3
🔸 Moving Average 50 ema
[5/18]


𝗖𝗘 𝗕𝘂𝘆 𝗥𝘂𝗹𝗲𝘀
🔸 Time Frame:3 min
🔸 Buy only when
🔸 Banknifty/Nifty is above 50 ema
🔸 Supertrend gives buy and candle closes above Supertrend
🔸 Enter on next candle opening
🔸 Take Entry only from 9:20 to 3:00 pm
🔸 Universal exit at 3:00
🔸 Premium Range 200
[6/18]
🔸 Time Frame:3 min
🔸 Buy only when
🔸 Banknifty/Nifty is above 50 ema
🔸 Supertrend gives buy and candle closes above Supertrend
🔸 Enter on next candle opening
🔸 Take Entry only from 9:20 to 3:00 pm
🔸 Universal exit at 3:00
🔸 Premium Range 200
[6/18]

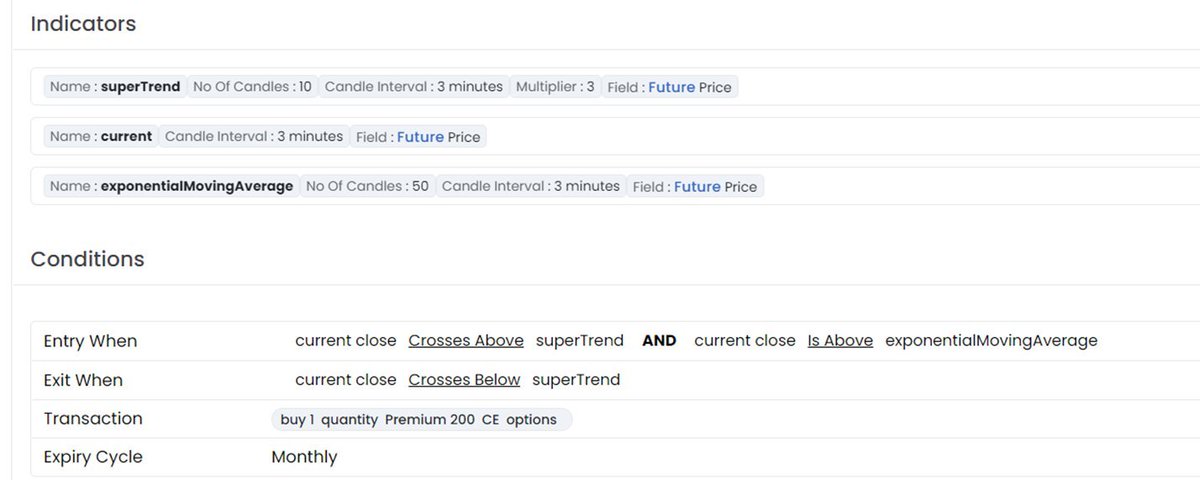
𝗘𝘅𝗶𝘁 𝗥𝘂𝗹𝗲𝘀
🔸 Banknifty/Nifty Closing Below Supertrend
🔸 No Target or Stoploss
🔸 Ride the trend till it lasts
Capital : 25000 Per lot for buying including Drawdown
[7/18]
🔸 Banknifty/Nifty Closing Below Supertrend
🔸 No Target or Stoploss
🔸 Ride the trend till it lasts
Capital : 25000 Per lot for buying including Drawdown
[7/18]


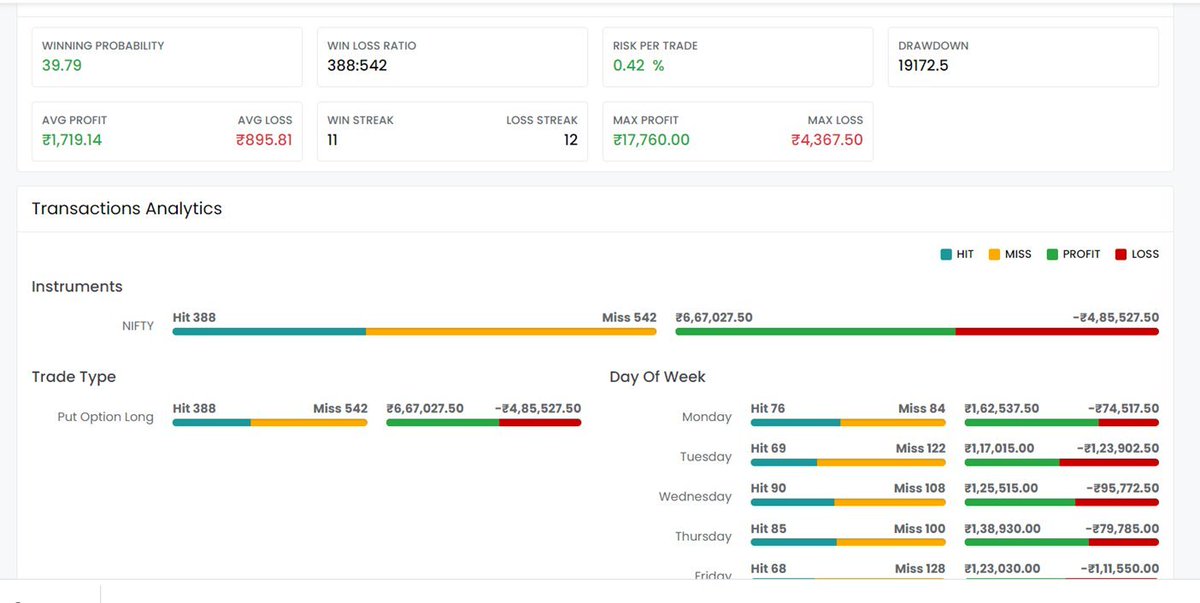
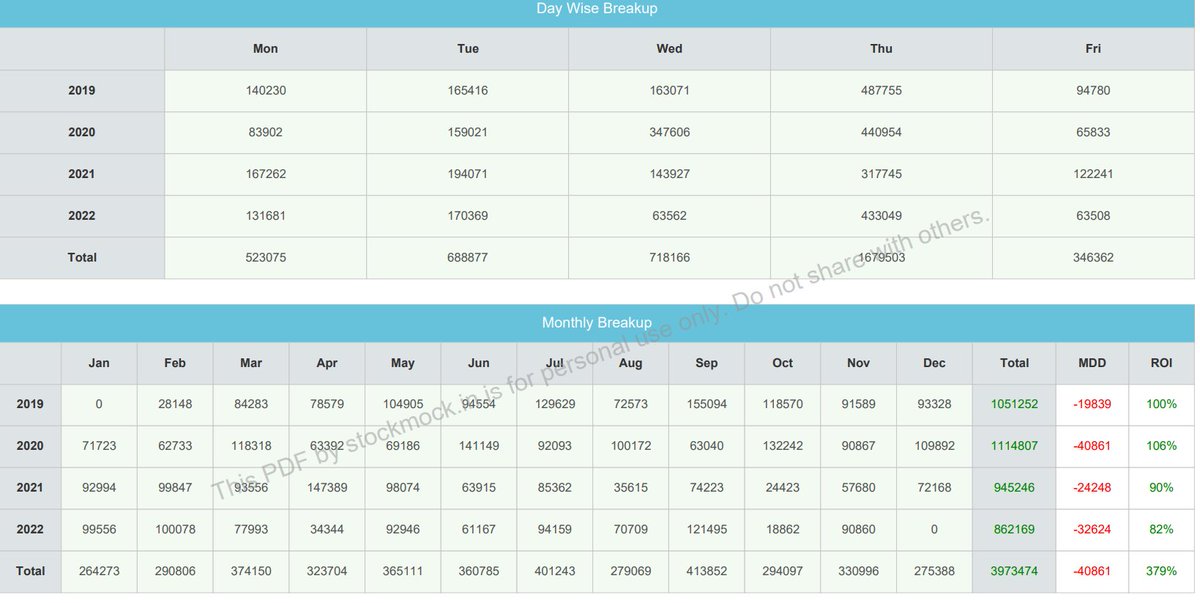
𝗦𝘁𝗿𝗮𝘁𝗲𝗴𝘆 𝗕𝗮𝗰𝗸𝘁𝗲𝘀𝘁 𝗳𝗼𝗿 𝗡𝗶𝗳𝘁𝘆:
🔸 Equity Curve
🔸 Profit and loss : Year and Month wise
🔸 Stoploss and Risk Reward Ratio
[8/18]
🔸 Equity Curve
🔸 Profit and loss : Year and Month wise
🔸 Stoploss and Risk Reward Ratio
[8/18]


𝗣𝗘 𝗕𝘂𝘆 𝗥𝘂𝗹𝗲
🔸 Time Frame: 3 min
🔸 Sell only when
🔸 Banknifty/Nifty is Below 21 ema
🔸 Supertrend gives Sell and candle closes below supertrend
🔸 Enter on next candle opening
🔸 Take Entry only from 9:20 to 3:00
🔸 Universal exit at 3:00 opening candle
[9/18]
🔸 Time Frame: 3 min
🔸 Sell only when
🔸 Banknifty/Nifty is Below 21 ema
🔸 Supertrend gives Sell and candle closes below supertrend
🔸 Enter on next candle opening
🔸 Take Entry only from 9:20 to 3:00
🔸 Universal exit at 3:00 opening candle
[9/18]

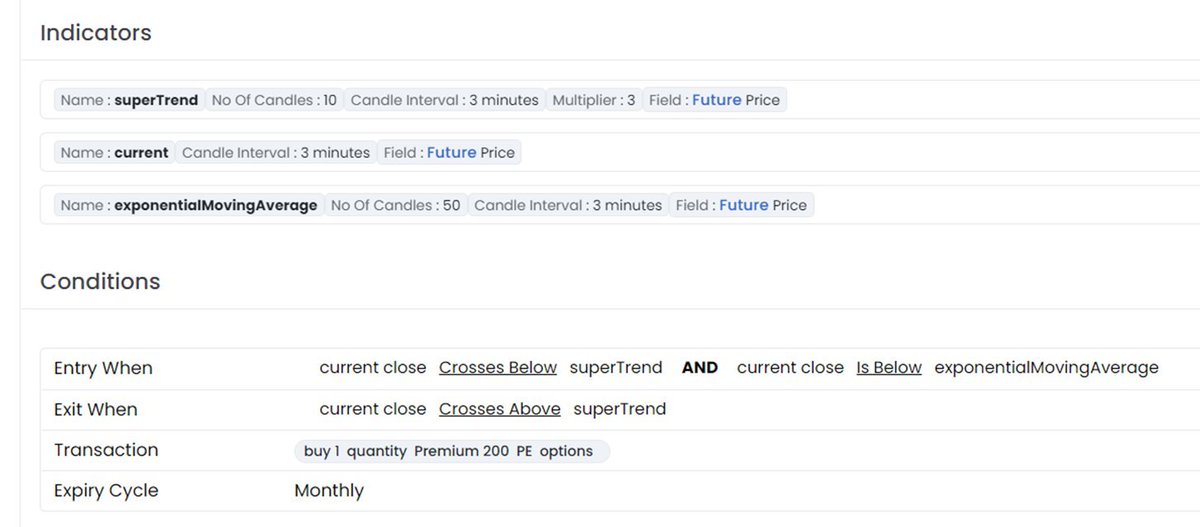
Exit Rules
🔸 Banknifty/Nifty Closing Below Supertrend
🔸 No Target or Stoploss
🔸 Ride the trend till it lasts
🔸 Capital : 35000 Per lot for buying including Drawdown
[10/18]
🔸 Banknifty/Nifty Closing Below Supertrend
🔸 No Target or Stoploss
🔸 Ride the trend till it lasts
🔸 Capital : 35000 Per lot for buying including Drawdown
[10/18]


Strategy Backtest on Nifty:
🔸 Equity Curve
🔸 Profit and loss : Year and Month wise
🔸 Stoploss and Risk Reward Ratio
[11/18]
🔸 Equity Curve
🔸 Profit and loss : Year and Month wise
🔸 Stoploss and Risk Reward Ratio
[11/18]

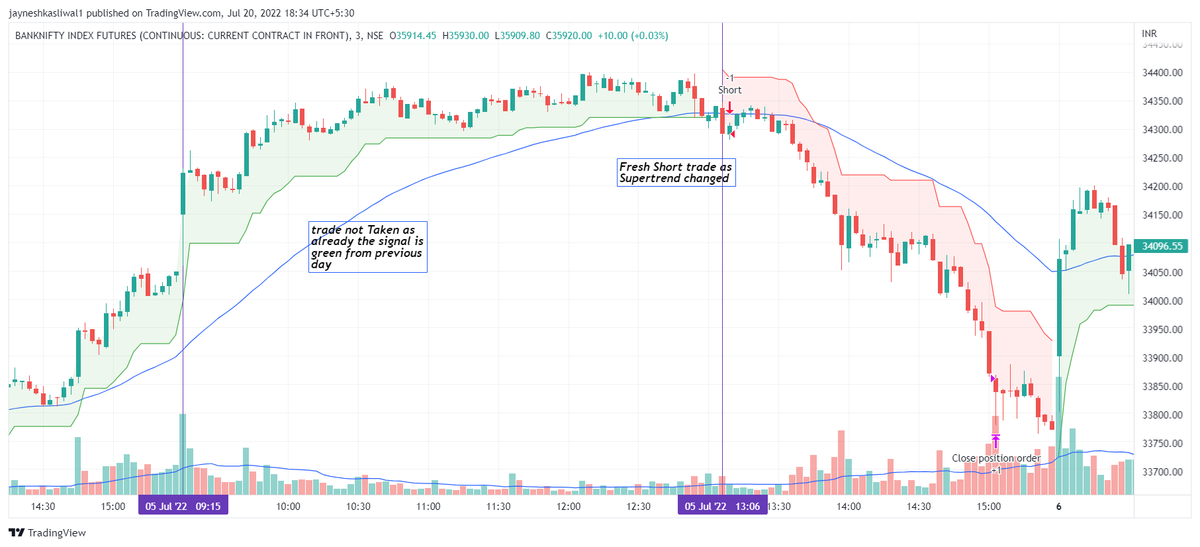
𝗪𝗵𝗲𝗻 𝗻𝗼𝘁 𝘁𝗼 𝘁𝗿𝗮𝗱𝗲?
🔸 We only take trades when supertrend has given short signal and the that time banknifty/nifty should be below 50 ema
🔸 If supertrend gives sell signal and banknifty/nifty is above 50 ema and then goes below it , we are not shorting it
[12/18]
🔸 We only take trades when supertrend has given short signal and the that time banknifty/nifty should be below 50 ema
🔸 If supertrend gives sell signal and banknifty/nifty is above 50 ema and then goes below it , we are not shorting it
[12/18]


𝘋𝘦𝘵𝘢𝘪𝘭𝘦𝘥 𝘠𝘰𝘶𝘵𝘶𝘣𝘦 𝘝𝘪𝘥𝘦𝘰 𝘓𝘪𝘯𝘬 ( 𝗗𝗼𝗻𝘁 𝗠𝗶𝘀𝘀 ! )
𝗣𝗿𝗼𝘀 of Stratgegy
🔸 High Returns in trending Markets
🔸 500% returns (pre taxes) in 3 years
🔸 Can be automated , no need to sit in front of screen
🔸 Easy to find and execute trades
🔸 Higher number of lots will reduce brokerage cost
[14/18]
🔸 High Returns in trending Markets
🔸 500% returns (pre taxes) in 3 years
🔸 Can be automated , no need to sit in front of screen
🔸 Easy to find and execute trades
🔸 Higher number of lots will reduce brokerage cost
[14/18]
𝗖𝗼𝗻𝘀 of the Strategy
🔸 High drawdown (50+%) from equity curve high
🔸 Many months drawdown period
🔸 Brokerage will be high% of profits in case of 1 lot
🔸 Strategy as a single cannot be scaled as expectancy is less
🔸 No of Trades would be high in sideways market
[15/18]
🔸 High drawdown (50+%) from equity curve high
🔸 Many months drawdown period
🔸 Brokerage will be high% of profits in case of 1 lot
🔸 Strategy as a single cannot be scaled as expectancy is less
🔸 No of Trades would be high in sideways market
[15/18]
The above Backtest is for Nifty and for Banknifty backtest PDF will be shared in Telegram Below :
t.me/Techno_Charts
t.me/Techno_Charts
𝙎𝙬𝙞𝙣𝙜 𝙏𝙧𝙖𝙙𝙞𝙣𝙜 𝙈𝙚𝙣𝙩𝙤𝙧𝙨𝙝𝙞𝙥
To learn more about " How to Pick Stocks For 50-100% Returns "
Join our 4 Week Mentorship program with upto 12 Hours of Live Sessions !
Payment Link : rpy.club/g/rhZQwO97TG
You will be sent joining link to your WhatsApp
To learn more about " How to Pick Stocks For 50-100% Returns "
Join our 4 Week Mentorship program with upto 12 Hours of Live Sessions !
Payment Link : rpy.club/g/rhZQwO97TG
You will be sent joining link to your WhatsApp


Mentoship Program Feedback :
What Mentees have to say : #𝗙𝗲𝗲𝗱𝗯𝗮𝗰𝗸
LINK FOR ENQUIRY: wa.link/si4jn4
Payment Link : rpy.club/g/rhZQwO97TG
What Mentees have to say : #𝗙𝗲𝗲𝗱𝗯𝗮𝗰𝗸
LINK FOR ENQUIRY: wa.link/si4jn4
Payment Link : rpy.club/g/rhZQwO97TG


• • •
Missing some Tweet in this thread? You can try to
force a refresh


