The Macro Pulse Profile picture
Dec 25, 2022 13 tweets 4 min read Read on X
🚨Get ready for a massive crash!🚨

I'm predicting that the S&P 500 and other indices will plummet an additional 40% from their current levels. Here's why:
1/ The recent rally was due to a decline in yields, as the market thought the FED would cut rates. But during the last FOMC meeting, J. Powell made it clear that more rate hikes are likely and the job isn't finished. Yields are now reflecting this and starting a new upward trend.
2/ The yield surge will result in a stronger US dollar. I predict a "double top" or a slightly new high for DXY. The surge in the US dollar will decimate equities and commodities, leading to a steep and illiquid sell-off.
3/ During a bear market, the largest percentage declines often happen at the end, leading to a significant decline in prices.
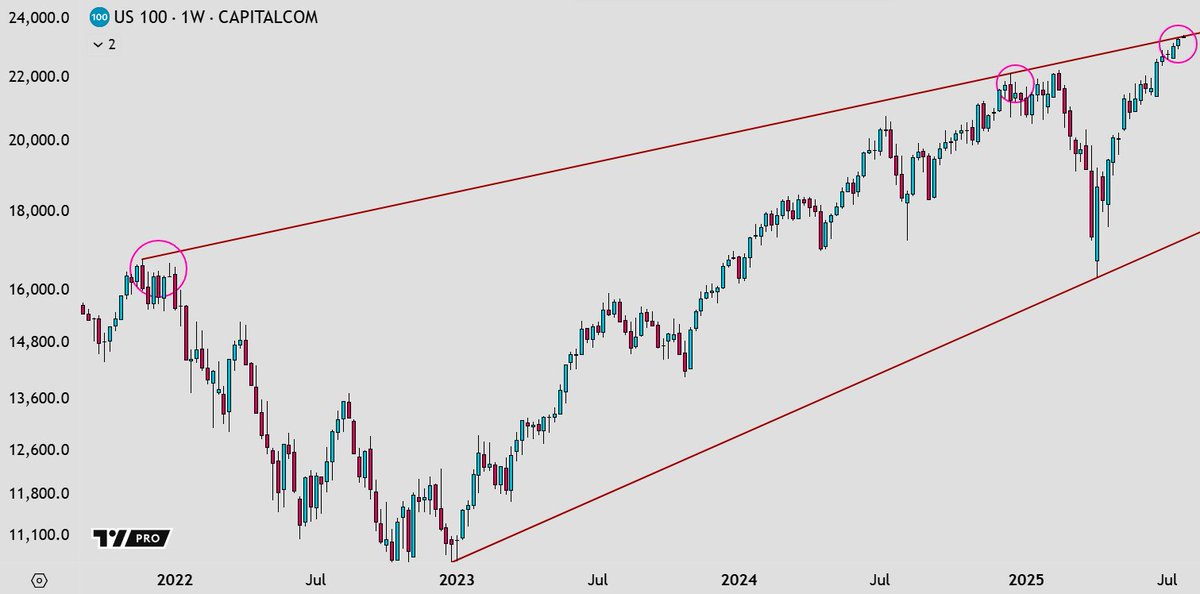
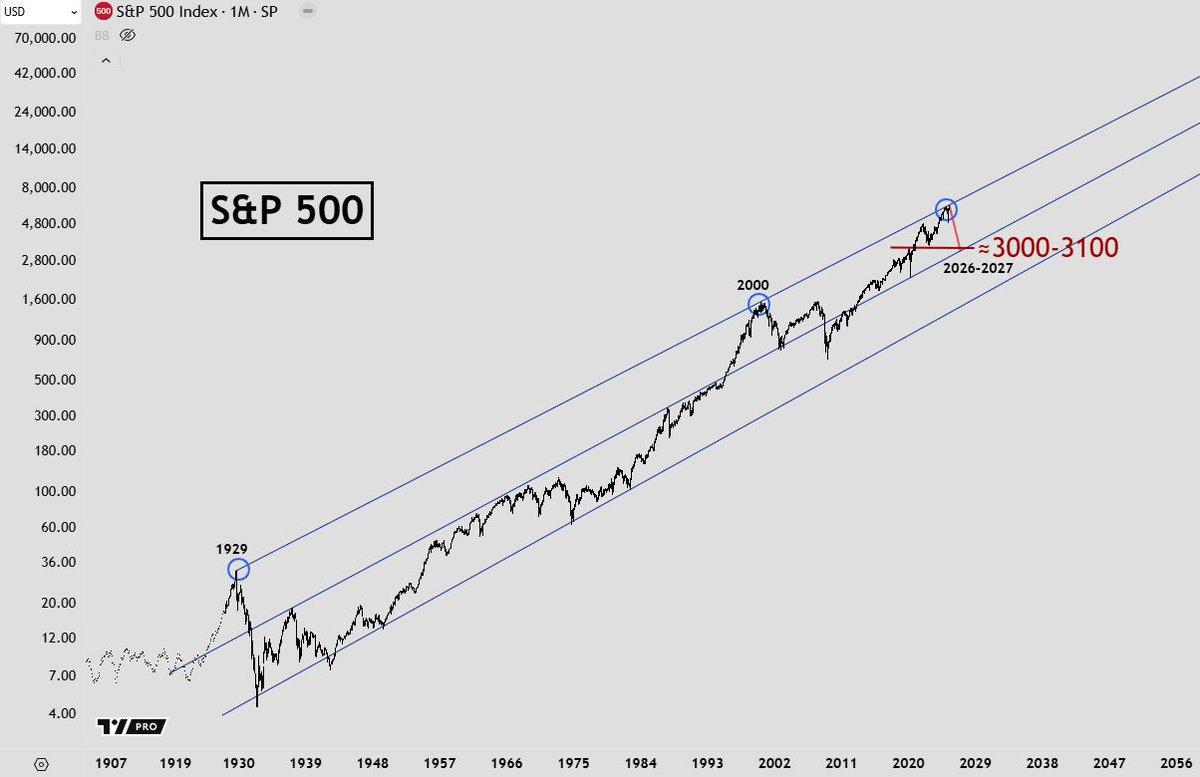
4/ The S&P 500's current price structure resembles 1973-1974, with similar megaphone patterns and shared factors of inflation and an oil crisis. If my forecasted steep, illiquid sell-off occurs, the market could fall another 40-55%.
5/ Even the price structure of the Russell 2000 is sending a clear warning. It is in a clear rising wedge formation, which typically leads to a pullback to Wave 4.
6/ The Federal Reserve's rapid rate hikes are causing lower corporate earnings, hurting consumer spending and business investments. This will lead to a stock market crash as lower earnings decrease a company's stock price and make it less attractive to investors.
7/ Bonds have been in a bull run since the 80s. I expect one more rally next year due to recession, but after that, rates will reverse and hit double digits later this decade. This will be a drastic change from the disinflationary environment we are used too.
8/ Rising interest rates are a major threat to stocks. They make borrowing more expensive for businesses, which hurts their profits and lead to a decrease in demand for their products or services.
9/ Tech stocks are likely to underperform in an inflationary cycle, while sectors such as consumer goods and services may be more likely to benefit from rising prices. Commodities may also be a good option, as they may be able to maintain or increase their value.
10/ Passive investing through index funds may not be as successful in the coming years as active management. As interest rates rise, we will see a shift from passive to active management as the market makes higher lows and lower highs.
11/ The end of the supercycle will bring a significant loss of wealth and a long downturn in the stock market, with stock prices falling and new highs in the indices unlikely for at least a decade. The cyclical bear market has begun.
🚨Get my latest predictions and market insights on Telegram and YouTube🚨

Follow me on Telegram: t.me/therealmfhoz

Subscribe to my Youtube Channel: youtube.com/@mfhoz4694

• • •

Missing some Tweet in this thread? You can try to force a refresh
 

Keep Current with The Macro Pulse

The Macro Pulse Profile picture

Stay in touch and get notified when new unrolls are available from this author!

Read all threads

This Thread may be Removed Anytime!

PDF

Twitter may remove this content at anytime! Save it as PDF for later use!

Try unrolling a thread yourself!

how to unroll video
  1. Follow @ThreadReaderApp to mention us!

  2. From a Twitter thread mention us with a keyword "unroll"
@threadreaderapp unroll

Practice here first or read more on our help page!

More from @TheMacroPulse

Jan 12, 2024
🧵 The 1999-2000 stock market crash, a timeline of the dot-com bubble’s burst, where fortunes were made and lost: Image
1/ Late 1999 - The Climax of Exuberance: The Nasdaq surges, driven by tech and internet stocks. It’s a frenzy of IPOs with valuations based on potential rather than profit. Alan Greenspan, then Fed Chairman, warns of “irrational exuberance” in the markets.
2/ January 2000 - The Peak: The Nasdaq hits an all-time high of over 5,000 in March. “We thought we were building Rome in a day,” recalls a Silicon Valley executive, reflecting the optimism.
Read 9 tweets
Jan 10, 2024
🧵2008 Financial Crisis: A Dramatic Timeline

🔻 Image
1/ "We have got the most dynamic financial markets in the world." - Early 2006, the market is buoyant, housing prices soar, and new complex financial products multiply unchecked.
2/ "The worst is likely to be behind us." - By mid-2006, despite these words, cracks appear. Housing prices start to falter, but the market's appetite for risk is unsatiated, blind to the brewing storm.
Read 17 tweets
Jan 9, 2024
🧵1929 Crash: A Timeline of Economic Catastrophe

🔻 Image
1. Early 1920s - The Roaring Prelude: A false dawn of prosperity. Post-WWI euphoria fuels a rampant stock market, setting the stage for disaster.
2. Mid-1920s - Warning Whispers: The Florida real estate bubble bursts. Yale economist Irving Fisher proclaims, “Stock prices have reached what looks like a permanently high plateau.” Little did he know…
Read 10 tweets
Jan 7, 2024
🧵 The Alarming Parallels: Tesla’s Bubble & Yahoo’s Collapse Image
1/ Tesla’s spectacular rise in the market is starting to mirror one of the largest speculative bubbles in history, alarmingly similar to Yahoo’s dramatic burst during the dot-com crash.
2/ Tesla, heralded as a revolutionary in the EV space, is riding on more hype than substance. This is reminiscent of Yahoo’s rapid rise, which was fueled more by market frenzy than by sustainable business practices.
Read 11 tweets
Dec 11, 2023
🧵 Contrary to popular belief, rising debt levels are more likely to trigger deflation rather than inflation. Let’s dive into why debt will be deflationary. Image
1/ Debt accumulation by consumers, businesses, or governments means future spending is brought forward. This spending creates a temporary boost in economic activity but at the cost of future demand.
2/ When debt levels become excessively high, the burden of repayments starts to weigh on economic actors. Consumers cut back on spending, businesses scale down investments, and governments might impose austerity measures.
Read 9 tweets
Nov 26, 2023
Why I believe Tesla is going to CRASH -90% over the next 2 years.

THREAD🧵 Image
1/10 Overblown Valuation?: Tesla's staggering $744.82 billion market cap overshadows BMW's $67.47 billion and Mercedes's $68.48 billion by over 10 times. Considering Tesla's lower car sales volumes, this valuation discrepancy is hard to justify. Image
2/10 Profit Margin Warning Signs: Tesla's profit margin has declined from a high of 24% in 2019 to around 15% in 2023, a clear signal of waning demand and escalating price competition. Continuing this downtrend, margins could dip under 10% by 2025. Image
Read 11 tweets

Did Thread Reader help you today?

Support us! We are indie developers!


This site is made by just two indie developers on a laptop doing marketing, support and development! Read more about the story.

Become a Premium Member ($3/month or $30/year) and get exclusive features!

Become Premium

Don't want to be a Premium member but still want to support us?

Make a small donation by buying us coffee ($5) or help with server cost ($10)

Donate via Paypal

Or Donate anonymously using crypto!

Ethereum

0xfe58350B80634f60Fa6Dc149a72b4DFbc17D341E copy

Bitcoin

3ATGMxNzCUFzxpMCHL5sWSt4DVtS8UqXpi copy

Thank you for your support!

Follow Us!

:(