Tivadar Danka Profile picture
Dec 29, 2022 15 tweets 5 min read Read on X
This stone tablet from 1800-1600 BC shows that ancient Babylonians were able to approximate the square root of two with 99.9999% accuracy.

How did they do it?
First, let’s decipher the tablet itself. It is called YBC 7289 (short for the 7289th item in the Yale Babylonian Collection), and it depicts a square, its diagonal, and numbers written around them.

Here is a stylized version.
As the Pythagorean theorem implies, the diagonal’s length for a unit square is √2. Let’s focus on the symbols there!

These are numbers, written in Babylonian cuneiform numerals. They read as 1, 24, 51, and 10.
Since the Babylonians used the base 60 numeral system (also known as sexagesimal), the number 1.24 51 10 reads as 1.41421296296 in decimal.
This matches √2 up to the sixth digit, meaning a 99.9999% accuracy!
The computational accuracy is stunning. To appreciate this, pick up a pen and try to reproduce this without a calculator. It’s not that easy!

Here is how the ancient Babylonians did it.
We start by picking a number x₀ between 1 and √2. I know, this feels random, but let’s just roll with it for now. One such example is 1.2, which is going to be our first approximation.
Because of this, 2/x₀ is larger than √2.
Thus, the interval [x₀, 2/x₀] envelopes √2.

From this, it follows that the mid-point of the interval [x₀, 2/x₀] is a better approximation to √2. As you can see in the figure below, this is significantly better!

Let's define x₁ by this.
Continuing on this thread, we can define an approximating sequence by taking the midpoints of such intervals.
Here are the first few terms of the sequence. Even the third member is a surprisingly good approximation.
If we put these numbers on a scatterplot, we practically need a microscope to tell the difference from √2 after a few steps.
Were the Babylonians just lucky, or did they hit the nail right on the head?

The latter one. If you are interested in the details, check out the full version of the post here: thepalindrome.substack.com/p/how-did-the-…
If you have enjoyed this explanation, share it with your friends and give me a follow! I regularly post deep-dive explainers such as this.
One more thing. The YBC 7289 tablet is actually clay, not stone.

This is my secret engagement tactic: I plant a simple error, then let others point it out.

(Just kidding. Seriously though, I always let a silly mistake through the cracks accidentally.)

• • •

Missing some Tweet in this thread? You can try to force a refresh
 

Keep Current with Tivadar Danka

Tivadar Danka Profile picture

Stay in touch and get notified when new unrolls are available from this author!

Read all threads

This Thread may be Removed Anytime!

PDF

Twitter may remove this content at anytime! Save it as PDF for later use!

Try unrolling a thread yourself!

how to unroll video
  1. Follow @ThreadReaderApp to mention us!

  2. From a Twitter thread mention us with a keyword "unroll"
@threadreaderapp unroll

Practice here first or read more on our help page!

More from @TivadarDanka

Oct 14
In machine learning, we use the dot product every day.

However, its definition is far from revealing. For instance, what does it have to do with similarity?

There is a beautiful geometric explanation behind: Image
By definition, the dot product (or inner product) of two vectors is defined by the sum of coordinate products. Image
To peek behind the curtain, there are three key properties that we have to understand.

First, the dot product is linear in both variables. This property is called bilinearity. Image
Read 15 tweets
Oct 13
Matrix factorizations are the pinnacle results of linear algebra.

From theory to applications, they are behind many theorems, algorithms, and methods. However, it is easy to get lost in the vast jungle of decompositions.

This is how to make sense of them. Image
We are going to study three matrix factorizations:

1. the LU decomposition,
2. the QR decomposition,
3. and the Singular Value Decomposition (SVD).

First, we'll take a look at LU.
1. The LU decomposition.

Let's start at the very beginning: linear equation systems.

Linear equations are surprisingly effective in modeling real-life phenomena: economic processes, biochemical systems, etc. Image
Read 18 tweets
Oct 11
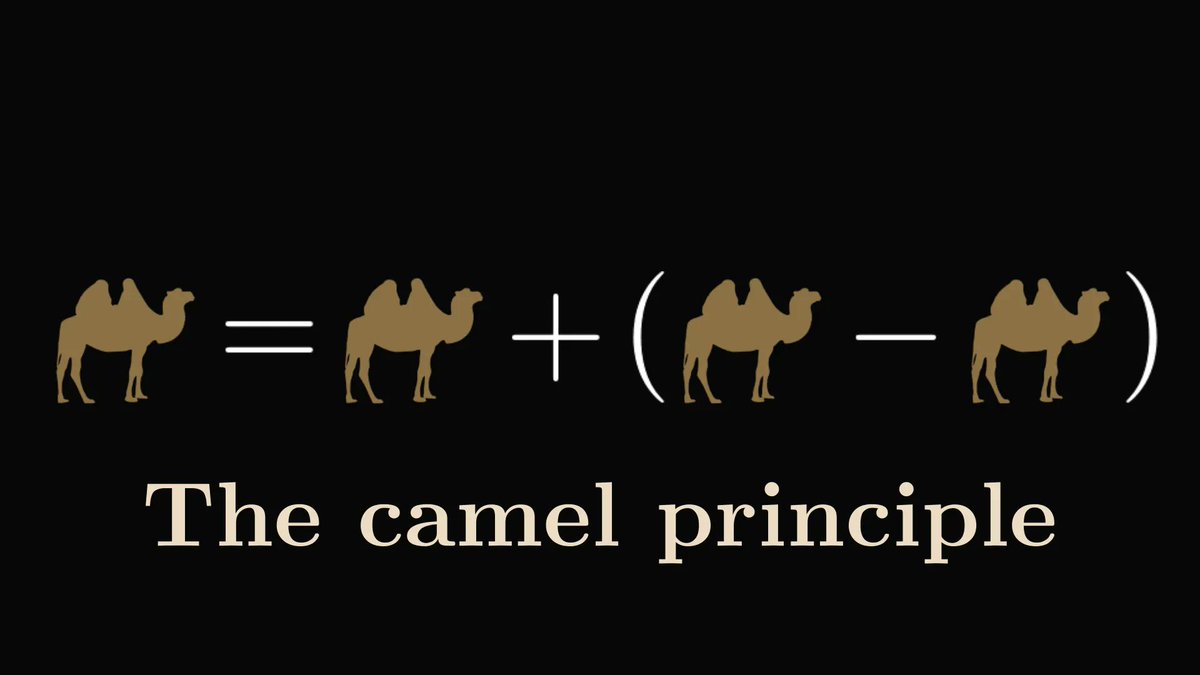
Behold one of the mightiest tools in mathematics: the camel principle.

I am dead serious. Deep down, this tiny rule is the cog in many methods. Ones that you use every day.

Here is what it is, how it works, and why it is essential: Image
First, the story:

The old Arab passes away, leaving half of his fortune to his eldest son, third to his middle son, and ninth to his smallest.

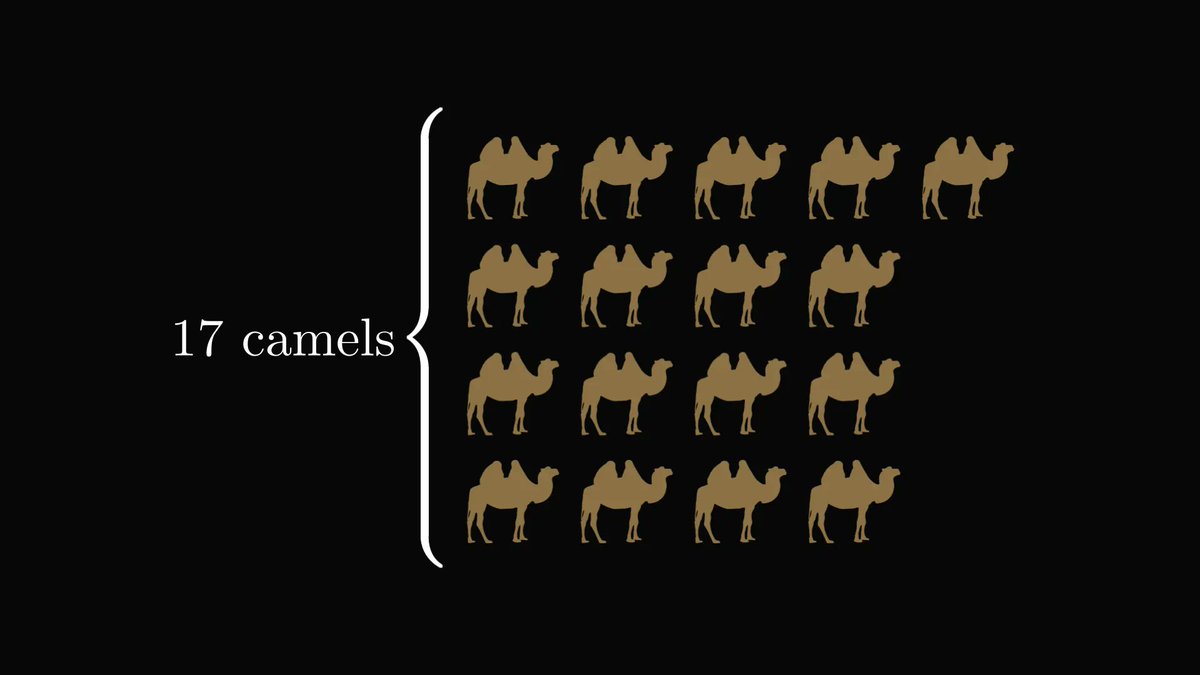
Upon opening the stable, they realize that the old man had 17 camels. Image
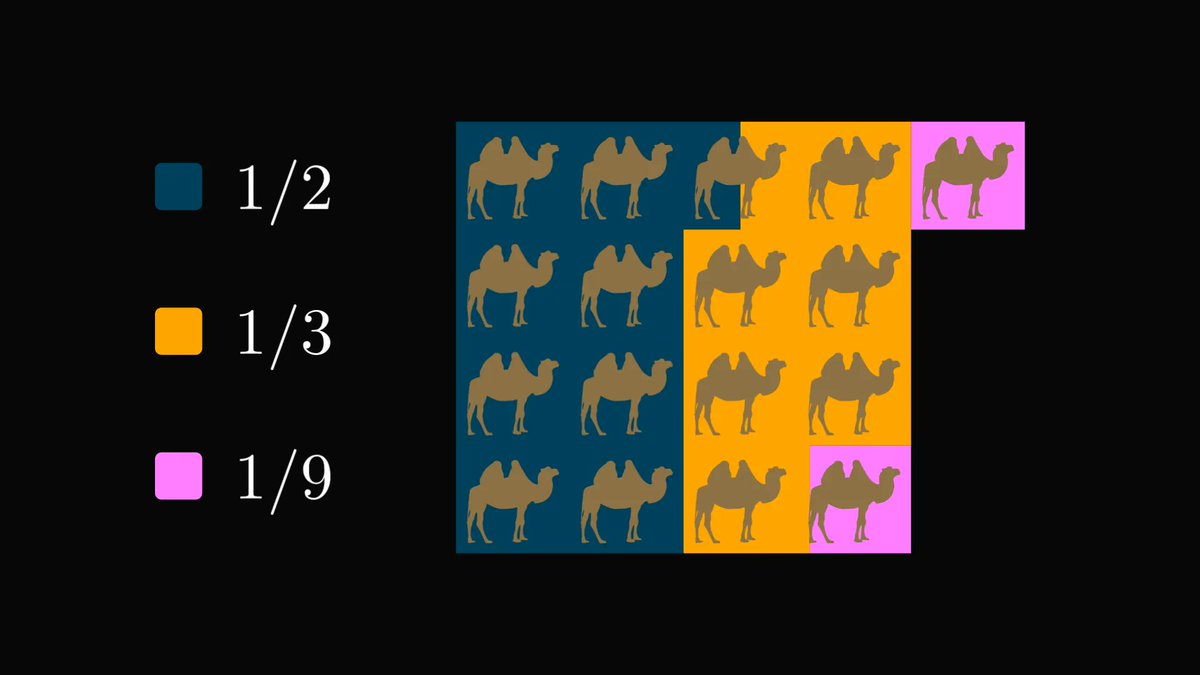
This is a problem, as they cannot split 17 camels into 1/2, 1/3, and 1/9 without cutting some in half.

So, they turn to the wise neighbor for advice. Image
Read 18 tweets
Oct 9
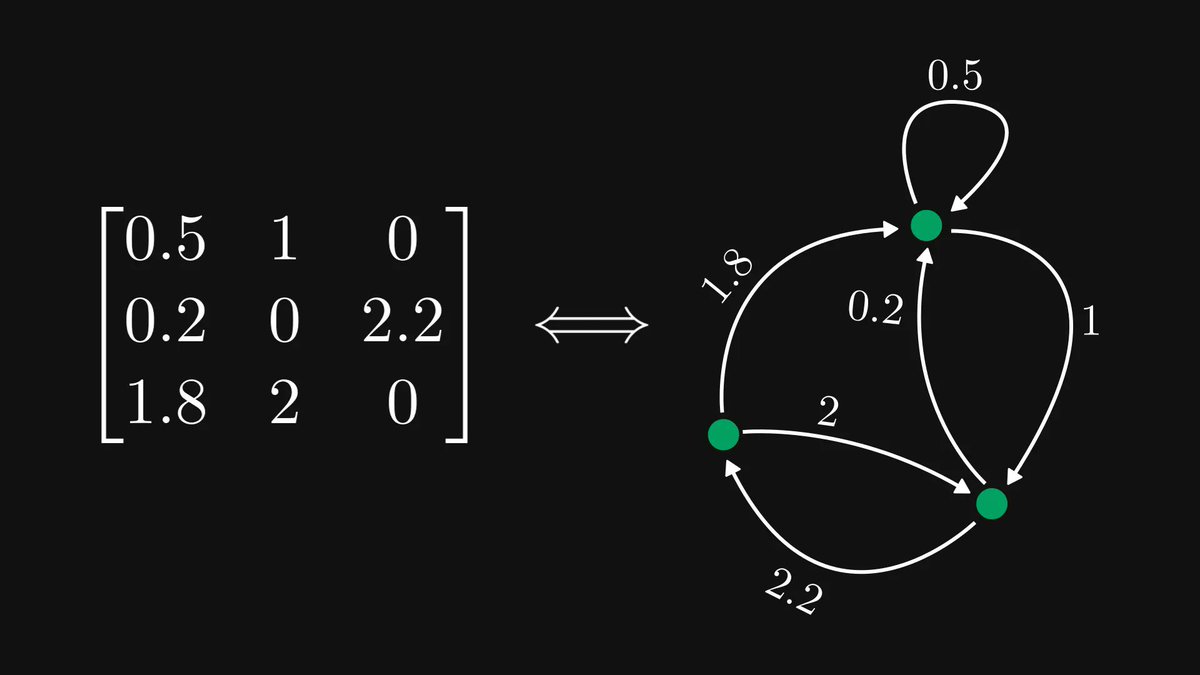
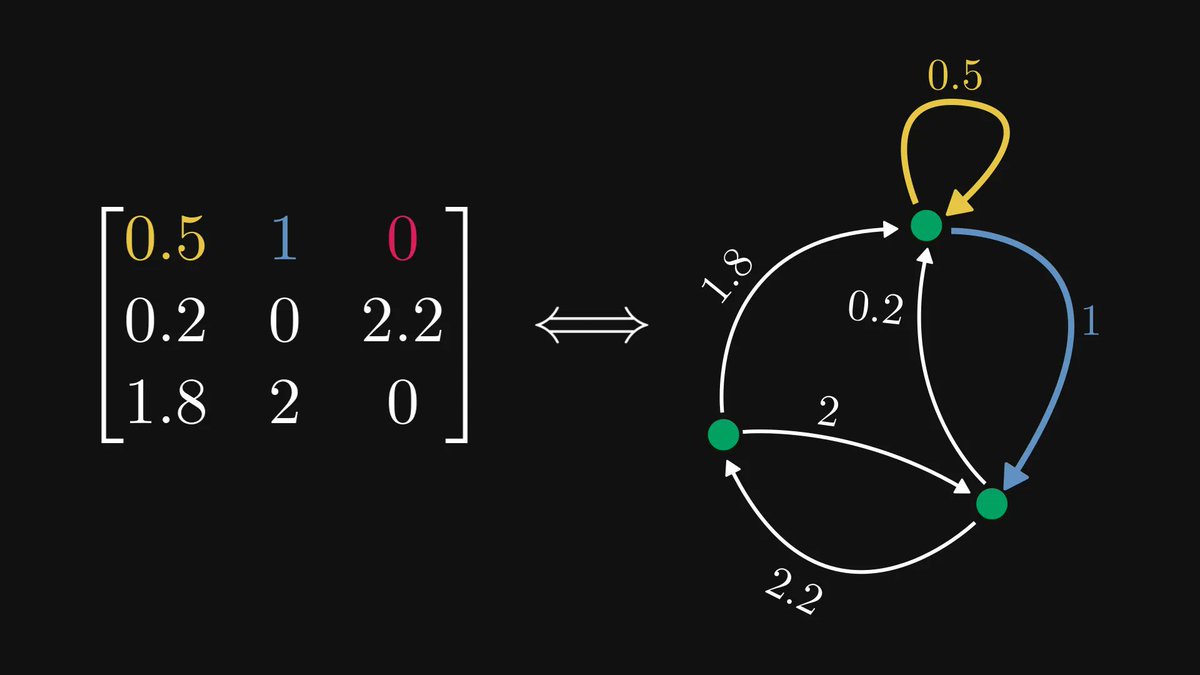
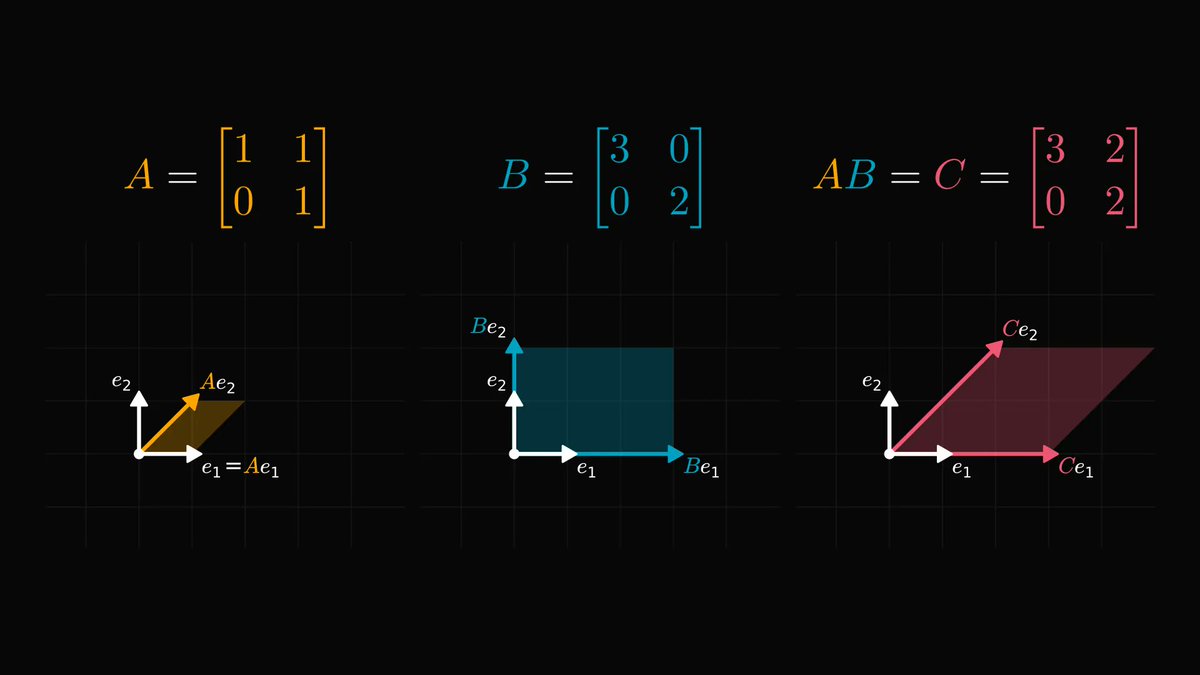
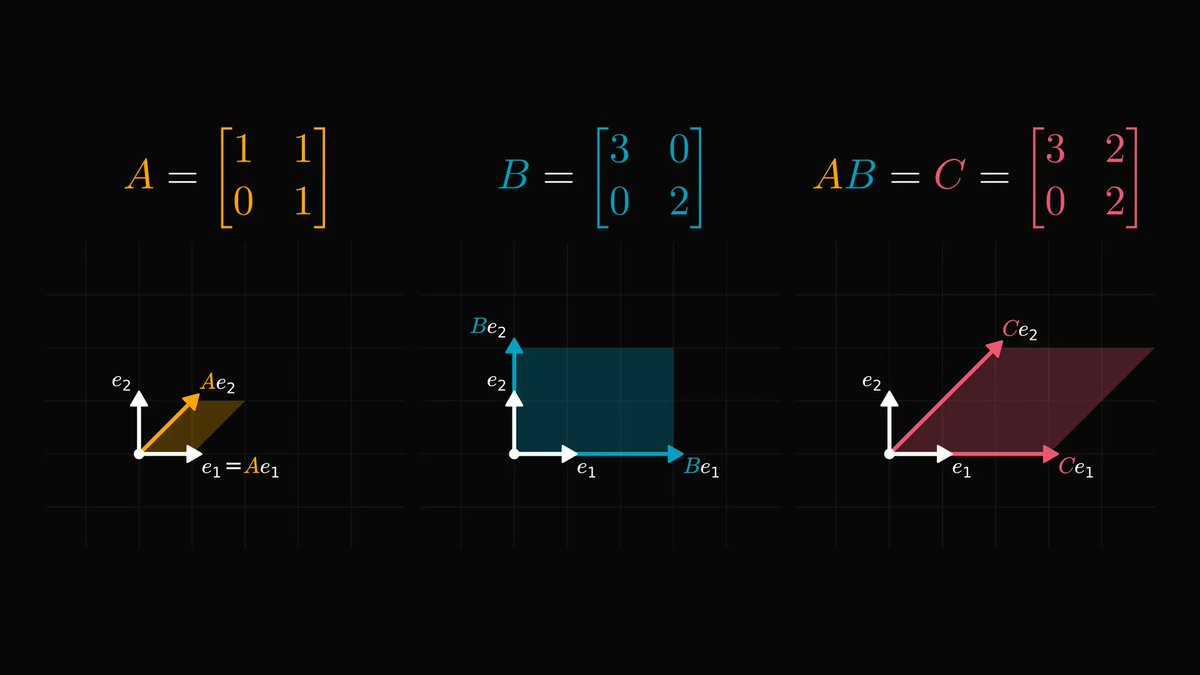
Matrix multiplication is not easy to understand.

Even looking at the definition used to make me sweat, let alone trying to comprehend the pattern. Yet, there is a stunningly simple explanation behind it.

Let's pull back the curtain! Image
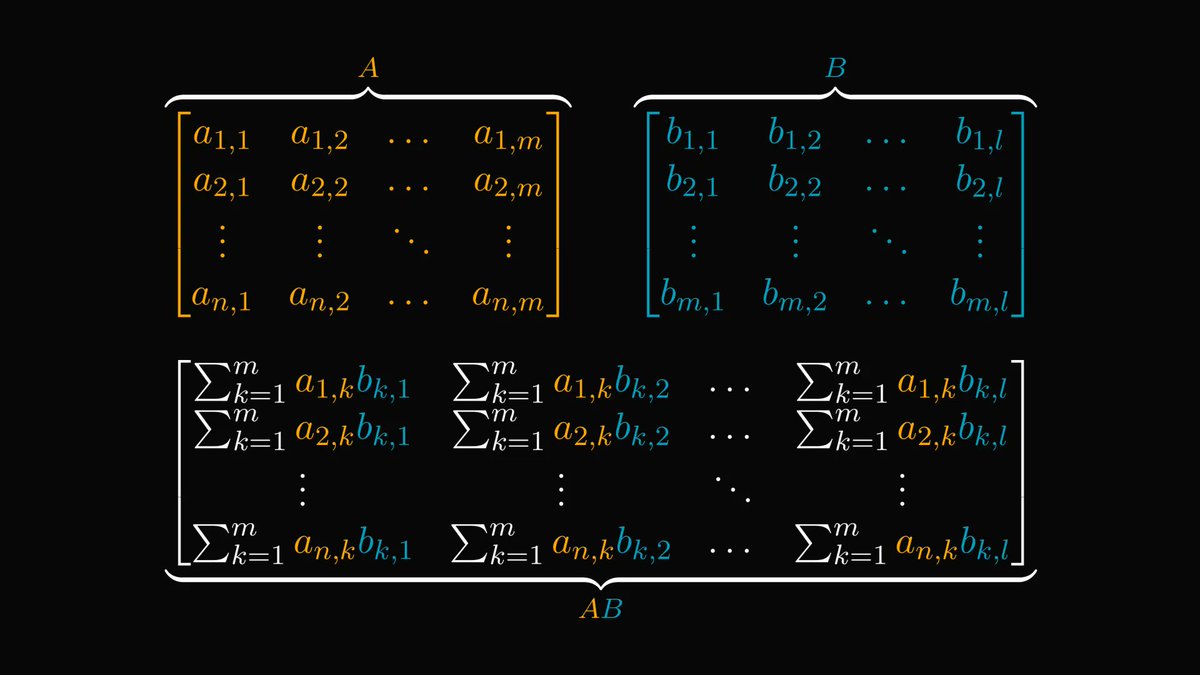
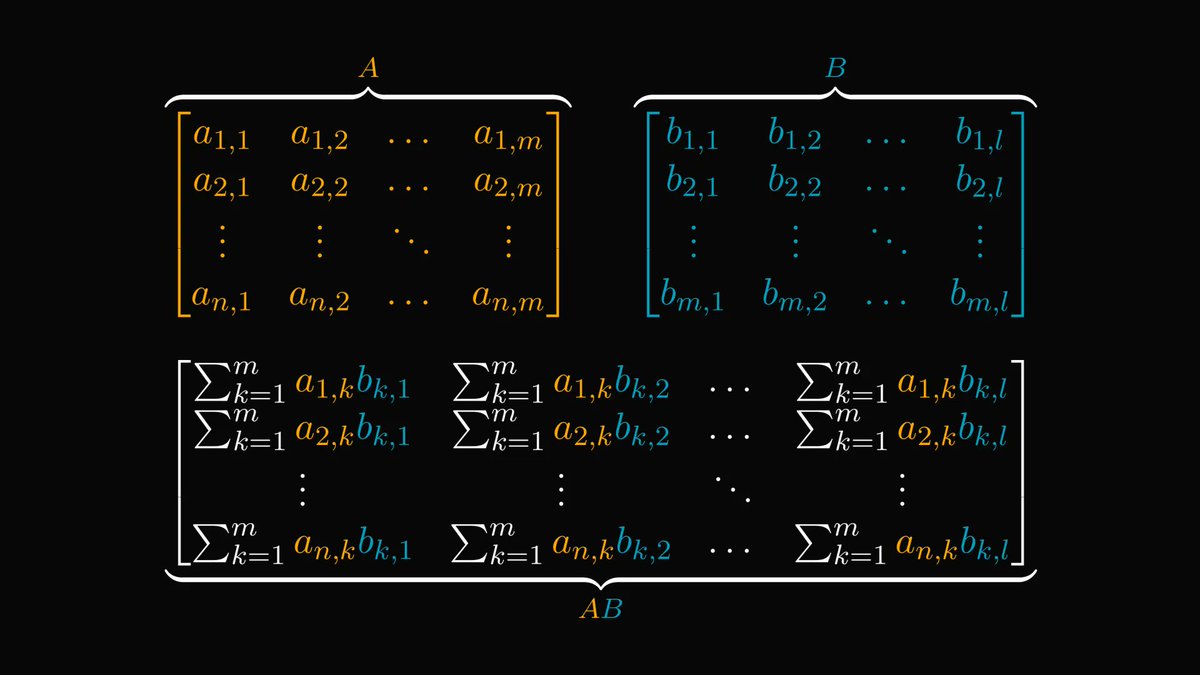
First, the raw definition.

This is how the product of A and B is given. Not the easiest (or most pleasant) to look at.

We are going to unwrap this. Image
Here is a quick visualization before the technical details.

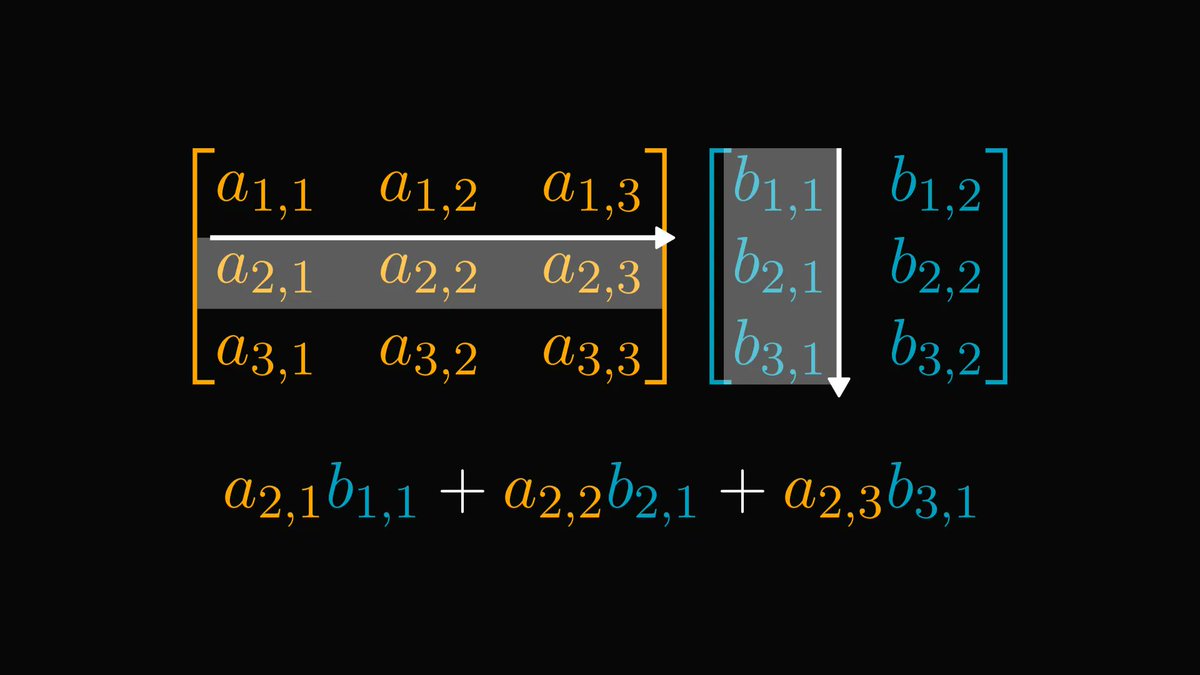
The element in the i-th row and j-th column of AB is the dot product of A's i-th row and B's j-th column. Image
Read 16 tweets
Oct 8
Graph theory will seriously enhance your engineering skills.

Here's why you must be familiar with graphs: Image
What do the internet, your brain, the entire list of people you’ve ever met, and the city you live in have in common?

These are all radically different concepts, but they share a common trait.

They are all networks that establish relationships between objects. Image
As distinct as these things seem to be, they share common properties.

For example, the meaning of “distance” is different for

• Social networks
• Physical networks
• Information networks

But in all cases, there is a sense in which some objects are “close” or “far”. Image
Read 14 tweets
Oct 7
One of the coolest ideas in mathematics is the estimation of a shape's area by throwing random points at it.

Don't believe this works? Check out the animation below, where I show the method on the unit circle. (Whose area equals to π.)

Here is what's behind the magic:
Let's make this method precise!

The first step is to enclose our shape S in a square.

You can imagine this as a rectangular dartboard. Image
Now, we select random points from the board and count how many hit the target.

Again, you can imagine this as closing your eyes, doing a 360° spin, then launching a dart.

(Suppose that you always hit the board. Yes, I know. But in math, reality doesn't limit imagination.) Image
Read 14 tweets

Did Thread Reader help you today?

Support us! We are indie developers!


This site is made by just two indie developers on a laptop doing marketing, support and development! Read more about the story.

Become a Premium Member ($3/month or $30/year) and get exclusive features!

Become Premium

Don't want to be a Premium member but still want to support us?

Make a small donation by buying us coffee ($5) or help with server cost ($10)

Donate via Paypal

Or Donate anonymously using crypto!

Ethereum

0xfe58350B80634f60Fa6Dc149a72b4DFbc17D341E copy

Bitcoin

3ATGMxNzCUFzxpMCHL5sWSt4DVtS8UqXpi copy

Thank you for your support!

Follow Us!

:(