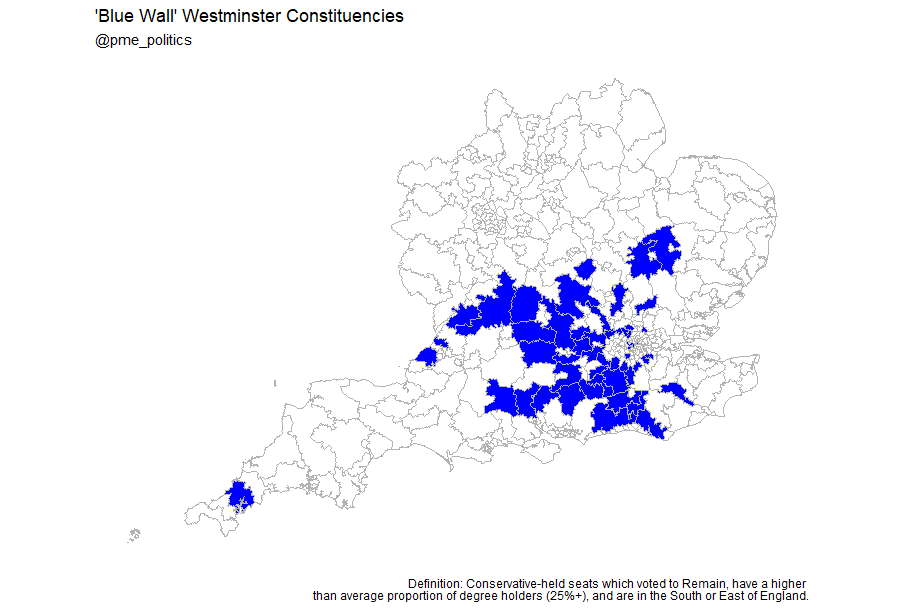
The UK might be getting older on average, but some areas are getting younger.
The mean change in folk aged 18-30 across the country is -1.2%.
But against the national ageing tide, there's a ‘Benjamin Button’ group of local authorities.
And they are political stardust.
1/🧵
The mean change in folk aged 18-30 across the country is -1.2%.
But against the national ageing tide, there's a ‘Benjamin Button’ group of local authorities.
And they are political stardust.
1/🧵

Firstly, some context. Let's take a look at London.
No other way of putting it - London is ageing.
Aside from Westminster (+0.2%), every single Borough is seeing a decrease in the relative size of its young population.
Including big drops in Newham (-6.0%) and Hounslow (-5.5%)
No other way of putting it - London is ageing.
Aside from Westminster (+0.2%), every single Borough is seeing a decrease in the relative size of its young population.
Including big drops in Newham (-6.0%) and Hounslow (-5.5%)

London is part of a wider pattern - the Great Ageing of English and Welsh metropoli.
Our largest cities are ageing faster than the national average:
Manchester (-4.3% aged 18-34 vs 2011)
Bradford (-2.0%)
Leeds (-1.8%)
Cardiff (-1.7%)
Birmingham (-1.6%)
Sheffield (-1.4%)
Our largest cities are ageing faster than the national average:
Manchester (-4.3% aged 18-34 vs 2011)
Bradford (-2.0%)
Leeds (-1.8%)
Cardiff (-1.7%)
Birmingham (-1.6%)
Sheffield (-1.4%)
But what about that 'Benjamin Button' group?
Well, have a look at some of these names:
West Lancashire (+1.8% aged 18-30 vs 2011)
Bath and NE Somerset (+1.3%)
NW Leicestershire (+1.1%)
Harborough (+1.1%)
East Suffolk (+1.0%)
Maldon (+1.0%)
Guildford (+0.7%)
Winchester (+0.7%)
Well, have a look at some of these names:
West Lancashire (+1.8% aged 18-30 vs 2011)
Bath and NE Somerset (+1.3%)
NW Leicestershire (+1.1%)
Harborough (+1.1%)
East Suffolk (+1.0%)
Maldon (+1.0%)
Guildford (+0.7%)
Winchester (+0.7%)
Now, here's where we come to the 'political stardust' bit.
In his original thread on the "red wall", @JamesKanag said "Around 80-90% of why certain seats vote for certain parties is explained by the demographics of the area".
Demography and geo-politics are endlessly intertwin
In his original thread on the "red wall", @JamesKanag said "Around 80-90% of why certain seats vote for certain parties is explained by the demographics of the area".
Demography and geo-politics are endlessly intertwin
The political angle: while our most urban (Labour voting) areas are ageing, we're seeing real-term growth in young populations across many (Conservative voting) small cities, suburbs, and semi-rural areas.
Wholescale demographic changes in our two major parties' safest seats.
Wholescale demographic changes in our two major parties' safest seats.
Younger folk are likelier to be more socially liberal, pro-immigration, have been hit harder by recent economic and cost of living crises, and to be in the most precarious employment and housing situations.
And so much more likely to vote Labour (or for a second-placed Lib Dem).
And so much more likely to vote Labour (or for a second-placed Lib Dem).
As I wrote for @ConHome, these numbers (+2% here, -2% there) might not seem like much, but they translate to thousands of people.
Take Winchester, for example. The latest Census population figure for the local authority is 127,500, having been reported at 116,595 in 2011.
Take Winchester, for example. The latest Census population figure for the local authority is 127,500, having been reported at 116,595 in 2011.
The population aged 18-30 has increased in Winchester from 15.2% in 2011 to 16.0% in 2021.
That’s almost 2700 extra young voters now in and around Steve Brine’s constituency, with the Lib Dems just 985 votes behind in second place. Just seven years ago, that gap was 16,914 votes
That’s almost 2700 extra young voters now in and around Steve Brine’s constituency, with the Lib Dems just 985 votes behind in second place. Just seven years ago, that gap was 16,914 votes
Back to our 'Benjamin Button' list, and let's take a simpler focus on just the South East and East of England (I say "Blue", you say "Wall"!).
A sea of pale blue (decline) is interrupted by punches of dark blue (growth) to the south and north east of London.
A sea of pale blue (decline) is interrupted by punches of dark blue (growth) to the south and north east of London.

Now, what do all those local authorities which have seen growth in their 18-30 year old populations have in common?
That's right - of the 42 MPs who represent constituencies within those council boundaries, exactly 42 of are Conservatives.
Yes - that's every single one of them.
That's right - of the 42 MPs who represent constituencies within those council boundaries, exactly 42 of are Conservatives.
Yes - that's every single one of them.
Notable MPs representing areas shaded in dark blue on that map include Priti Patel (former Home Secretary), Michael Gove (current Secretary of State for Levelling Up), Kit Malthouse (once of Brexit compromise fame), and Caroline Nokes (Chair of the Women and Equalities Committee)
So, to bring it all together:
1) UK is ageing, but some areas are getting younger (the ‘Benjamin Buttons’)
2) Many such areas are suburban/small cities
3) They also invariably have Conservative MPs - newsflash, *Blue Wall*!
4) Young folk are very unlikely to vote Conservative
1) UK is ageing, but some areas are getting younger (the ‘Benjamin Buttons’)
2) Many such areas are suburban/small cities
3) They also invariably have Conservative MPs - newsflash, *Blue Wall*!
4) Young folk are very unlikely to vote Conservative
Is this a pandemic effect?
Doesn’t look like it - see the evidence in the thread below 👇
Doesn’t look like it - see the evidence in the thread below 👇
https://twitter.com/pme_politics/status/1608803262815424516
• • •
Missing some Tweet in this thread? You can try to
force a refresh


