Patrick English Profile picture
Director of Political Analytics @YouGov. Polling, elections, and survey methods. Visiting fellow @exeterpolitics & @MethodologyLSE Pol Sci PhD. All views my own
@littlegravitas@c.im 🇺🇦 🇪🇺 🇮🇱 🇵🇸 #FBPE Profile picture 1 subscribed
Apr 7 11 tweets 3 min read
So it’s great, super, to see public opinion research on Muslim Brits being carried out and published.

However, I’m a bit uncomfortable about this particular poll.

It does not come with anywhere near the correct caveats that it should (that I’ve seen) given its topic and design. The subject and subjects of this poll is deeply sensitive and very political.

But the sample frame, as I understand it from James’ reporting, does not control for political background, engagement, nor religiosity. All which I expect to correlate deeply with the opinions measured
Dec 29, 2022 14 tweets 4 min read
The UK might be getting older on average, but some areas are getting younger.

The mean change in folk aged 18-30 across the country is -1.2%.

But against the national ageing tide, there's a ‘Benjamin Button’ group of local authorities.

And they are political stardust.

1/🧵 Firstly, some context. Let's take a look at London.

No other way of putting it - London is ageing.

Aside from Westminster (+0.2%), every single Borough is seeing a decrease in the relative size of its young population.

Including big drops in Newham (-6.0%) and Hounslow (-5.5%)
Sep 29, 2022 8 tweets 2 min read
🚨A thirty-theee point lead🚨

How did we get here? Is it real? Is it just a fluke?

What about the don’t knows, and potential response bias?

Here’s a thread covering all the technical goodies included in our bumper VI article here: yougov.co.uk/topics/politic…

1/ 🧵 Labour’s massive polling lead has three important sources:

➡️ Conservative 2019 voters switching directly to Labour
❓Conservative voters who now “don’t know” who they would vote for now
🔶 A squeeze on the Liberal Democrats
Jun 28, 2022 10 tweets 4 min read
Thread 🧵on fascinating UK Census population data released today and how it ties into British politics as we see it.

Firstly, a map of population change across England and Wales from 2011 to 2021.

Most areas have grown in population, but the most urban areas have grown fastest. Image Local authorities with population densities above 30 people per square kilometre (top 12%) grew by an average of around 8% on 2022.

Those with densities below 1 (bottom 12%) grew by just 3%.

There was also fast growth in some semi-urban areas, particularly in the East and South
Nov 10, 2021 5 tweets 2 min read
Fresh @YouGov research by @SarahPrescottS and I looks at public opinion on climate spending.

The environment hit 40% in our 'most important issues' tracker this week, just three points behind the economy.

But what would Brits be willing to sacrifice for more climate investment? In what's called a "conjoint experiment", we asked respondents to tell us if they would rather see government investment in 'the environment' or another randomised policy area.

The results suggest the public still sees the environment as a middle-order priority for investment.
Jul 30, 2021 9 tweets 3 min read
Say hello again to the Blue Wall.

These are Conservative held constituencies which:
- Are estimated to have voted to Remain in 2016 (h/t @chrishanretty)
- Have 25%+ graduates in population
- Are in the South and East

And we’ve just polled them.

thetimes.co.uk/article/boris-… What did we find?

1) High levels of dissatisfaction with government, Boris, and the direction the country is going in.
2) Tories down 8points on 2019, with a 6-point swing to Labour.
3) They would vote to rejoin the EU.
4) There’s still no culture war.

yougov.co.uk/topics/politic…
Jun 20, 2021 9 tweets 4 min read
The Blue Wall.

What is it, and why should we care?

Well, by my reckoning, the 53-seat strong Blue Wall is a line of Conservatives-held constituencies in the South of England, stretching from Lewes to Stroud.

Plus a few 'islands' dotted across the South and East of England. 
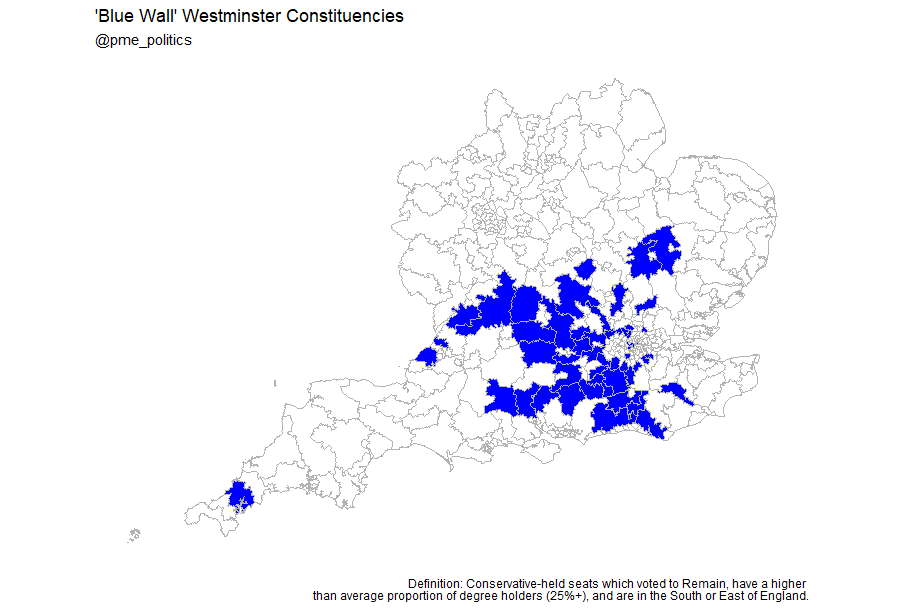
The definition I am working with is heavily based on work in Brexitland done by @ProfSobolewska and @robfordmancs:

- Voted to Remain in 2016 (according to @chrishanretty estimates)
- Have a higher than average (25%+) proportion of graduates
- Are in the South or East of England
Jun 18, 2021 12 tweets 4 min read
Alrighty, Chesham and Amersham!

Lib Dem gain, swing of 25pts.

This thread will be specifically about the by-election. I’ll do a separate one on the ‘Blue Wall’ idea and what C&A tells us about the Gold shift hypothesis later.

First up, should we have seen this coming?

Yes. Things always, always look easier and clearer in hindsight, so I’m not going to do any daft “I told you so” takes.

But if you’ll indulge me, cast your mind back to May, then to Dec 2019.

Places like C&A have been trending away from the Conservatives for a number of years now.
May 8, 2021 7 tweets 2 min read
From data collected and analysed by the BBC (1247 'key wards' across the country), we can calculate an implied swing since the 2019 General Election.

That figure is a 3-point swing toward Labour.

If applied uniformly across the GB, that would be around:

Con: 340 seats
Lab: 221 The swing is differential across different regions of the country.

For example, there has been a swing to Labour of around 5 points in the West Midlands, but there was a swing *to the Conservatives* of around 1 point in the North West.
May 6, 2021 12 tweets 3 min read
So, #SuperThursday polls have closed!

Thanks to everyone involved behind the scenes in making sure this democratic exercise could take place.

Here are a few thoughts about what I think we might see over the next few days as results come in. It's going to be quite a ride!

1/n
First - yes, it's the "red wall".

A large number of councils in the north and midlands where the Conservatives won a traditionally Labour-held constituency in 2019 held elections today.

But while both Dudley and Durham share that definition, they're apples and pears for today.