$KALA +$679,165.08
Little happy new year chart from me today. I thought you would enjoy this one as it diverges a bit from the usual setups.
Shorted yesterday and got stopped out for -40k. I realized what this was shortly after and started loading in maintaining a strong avg.
Little happy new year chart from me today. I thought you would enjoy this one as it diverges a bit from the usual setups.
Shorted yesterday and got stopped out for -40k. I realized what this was shortly after and started loading in maintaining a strong avg.

1-1.5mil float, however all brokers had shares yesterday and today, far from 1$+ locates he should have for this type of float and range.
Not one trader either in private rooms or Twitter was long bias on this and all were involved.
Not one trader either in private rooms or Twitter was long bias on this and all were involved.

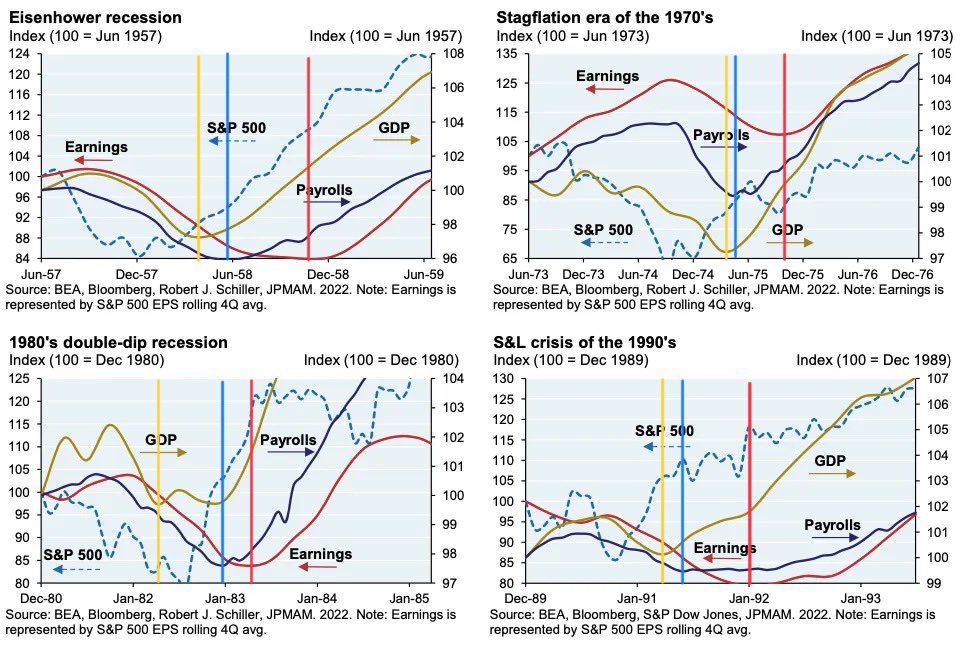
Seasonality is important for this setup. You see confidence cycles where shorts become too comfortable and drop their standard. This is where we are/were today.
Woke up earlier today and watched it grind, I added up to 45kish and got some off into $45.
Woke up earlier today and watched it grind, I added up to 45kish and got some off into $45.
I went through every single parabolic play of the last 5y preparing for today.
According to the update I added into the morning dip expecting something similar to $LFIN, with a double stuff into 11am opening up.
We shouldn’t come back on this setup so I cut all accordingly.
According to the update I added into the morning dip expecting something similar to $LFIN, with a double stuff into 11am opening up.
We shouldn’t come back on this setup so I cut all accordingly.

This could easily have been a $3mil trade today.
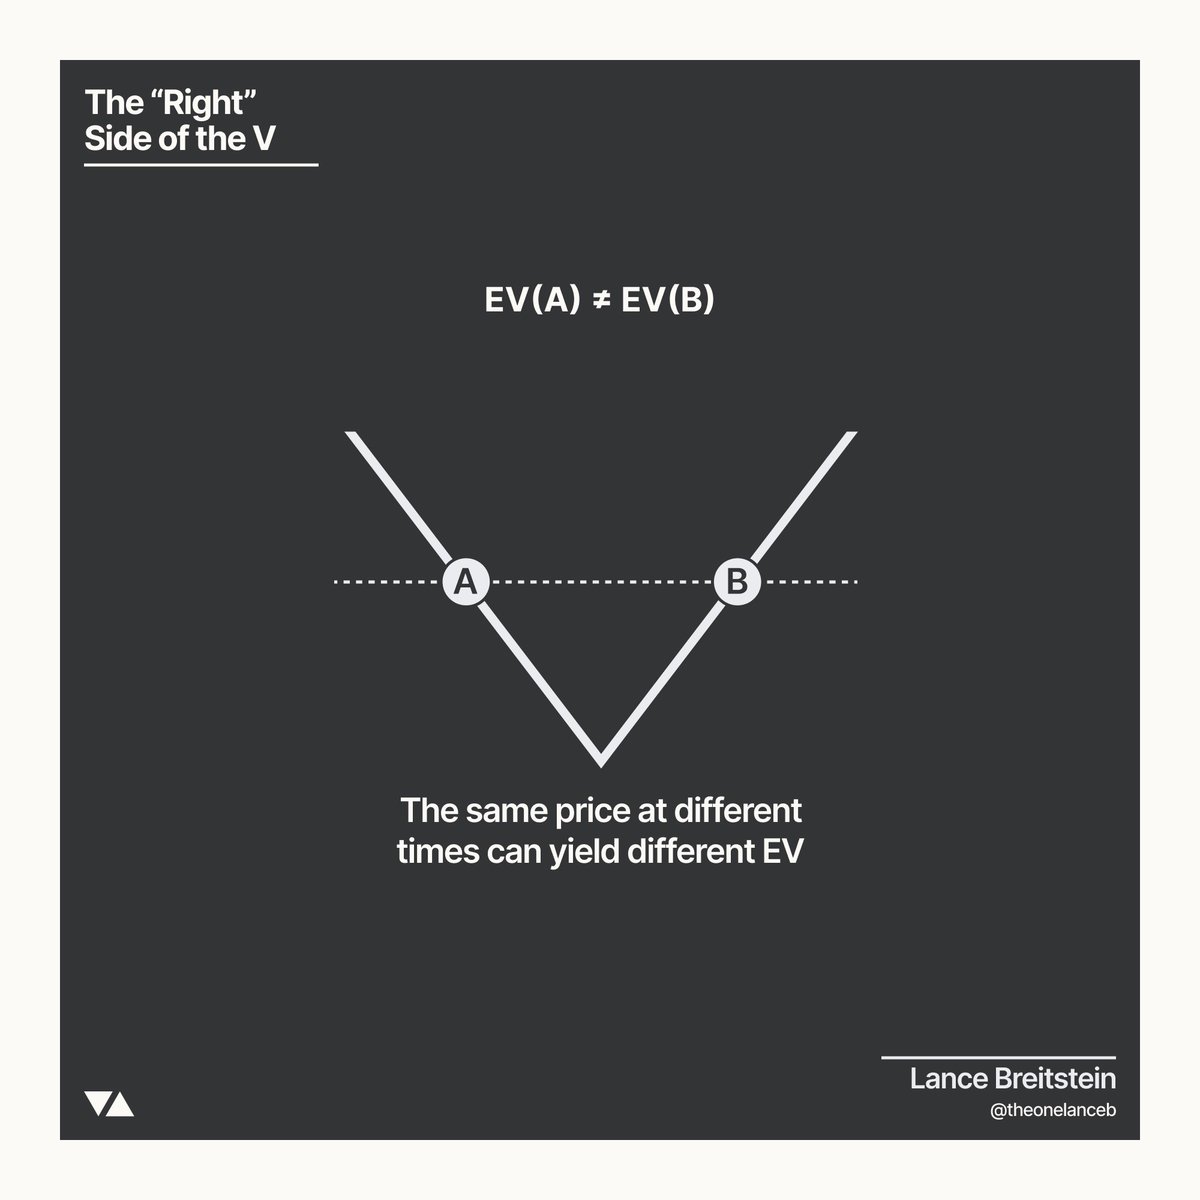
I wanted to share this one because it shows a different setup but also shows what I consider a failed trade.
This is dynamic management and maximization of an opp.
DYNAMIC EV (@TheOneLanceB has good material on it)
I wanted to share this one because it shows a different setup but also shows what I consider a failed trade.
This is dynamic management and maximization of an opp.
DYNAMIC EV (@TheOneLanceB has good material on it)

One more thing that made this the perfect day for this setup is the offerings we got on $PALI and $HOTH.
Killed the long confidence, made shorts fomo to catch the only play standing.
A cocktail of emotions that gifted those with a clear mind an advantageous outcome.
Killed the long confidence, made shorts fomo to catch the only play standing.
A cocktail of emotions that gifted those with a clear mind an advantageous outcome.
Finally the underwriters holding $KALA were Baker Bros
Bake Bros is a biotech investor group that historically does not sell quickly, this is not Cantor, H.C. Wainwright or Maxim..
These are conviction buyers for the most part
More from our friends at:
knowledge.dilutiontracker.com/en/articles/68…
Bake Bros is a biotech investor group that historically does not sell quickly, this is not Cantor, H.C. Wainwright or Maxim..
These are conviction buyers for the most part
More from our friends at:
knowledge.dilutiontracker.com/en/articles/68…
• • •
Missing some Tweet in this thread? You can try to
force a refresh