There's too many Realtors.
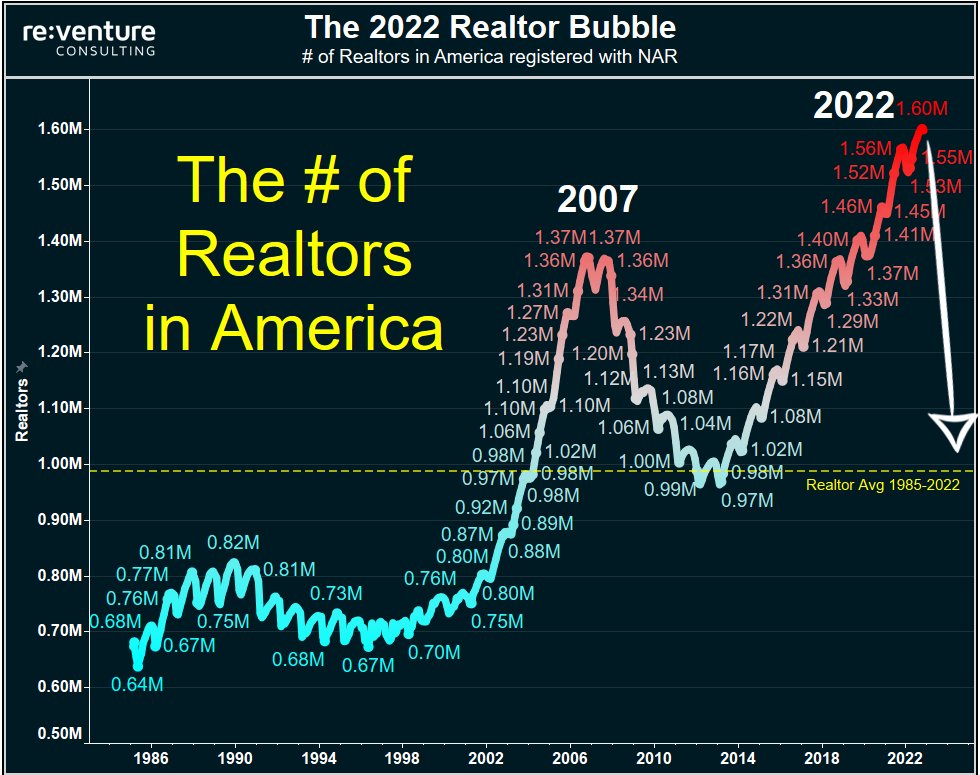
1.6 Million currently registered with NAR. That's higher than 2007 Bubble.
📉30% of Realtors will likely quit during this Housing Crash. Once that happens, you'll know bottom is approaching.
1.6 Million currently registered with NAR. That's higher than 2007 Bubble.
📉30% of Realtors will likely quit during this Housing Crash. Once that happens, you'll know bottom is approaching.
Consider this:
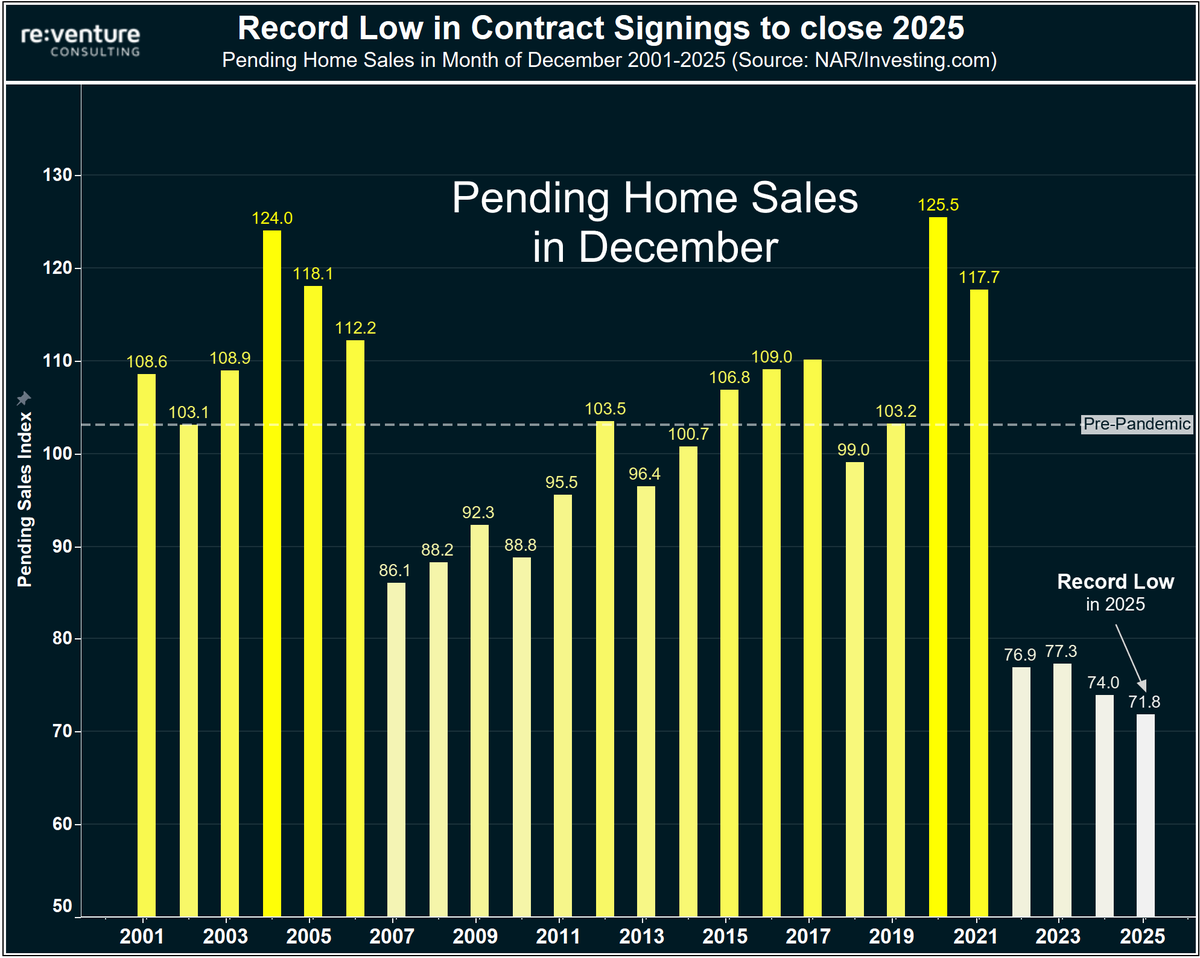
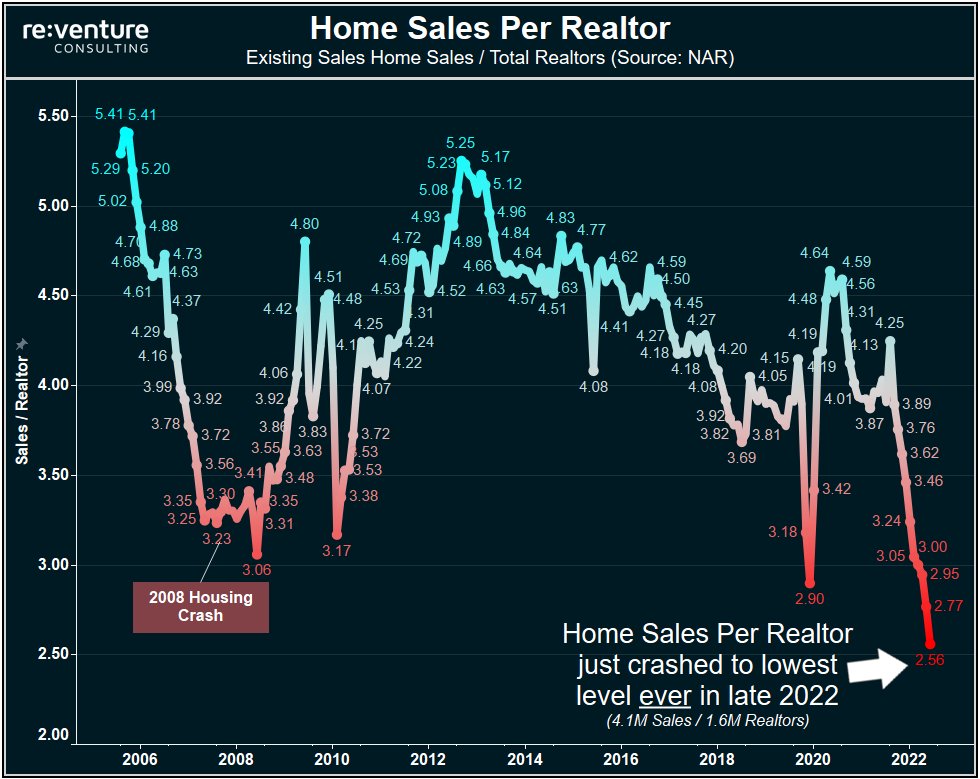
Home Sales / Realtor collapsed to lowest level on record in 2022.
Even lower than the depths of the 2008 Housing Crash.
(Source: NAR)
Home Sales / Realtor collapsed to lowest level on record in 2022.
Even lower than the depths of the 2008 Housing Crash.
(Source: NAR)
The Housing Bubble has popped, but the Bubble mentality has NOT.
1.6 Million Realtors are still "holding on", thinking the Housing Market will improve in 2023.
History says it won't.
1.6 Million Realtors are still "holding on", thinking the Housing Market will improve in 2023.
History says it won't.
But watch out for when these Realtors inevitably quit in 2023.
When they quit, it will likely coincide with investors/flippers/stubborn sellers "quitting" as well.
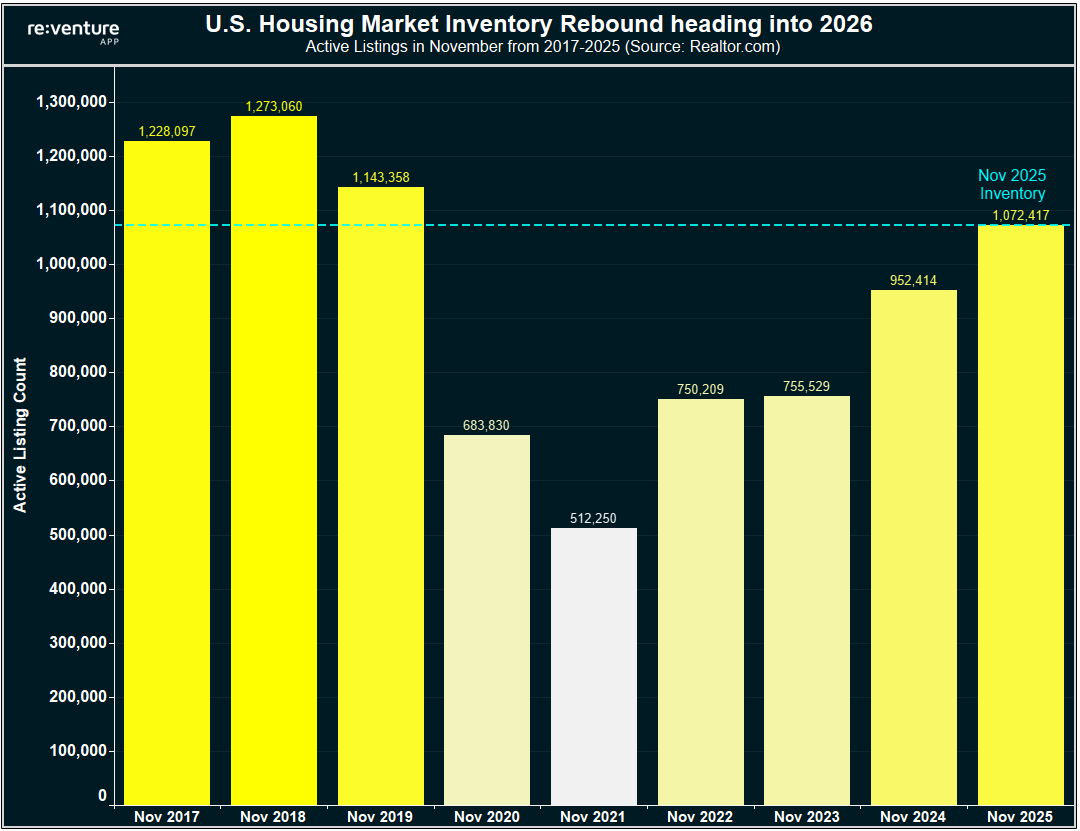
And that's when you'll see inventory/listings really explode.
When they quit, it will likely coincide with investors/flippers/stubborn sellers "quitting" as well.
And that's when you'll see inventory/listings really explode.
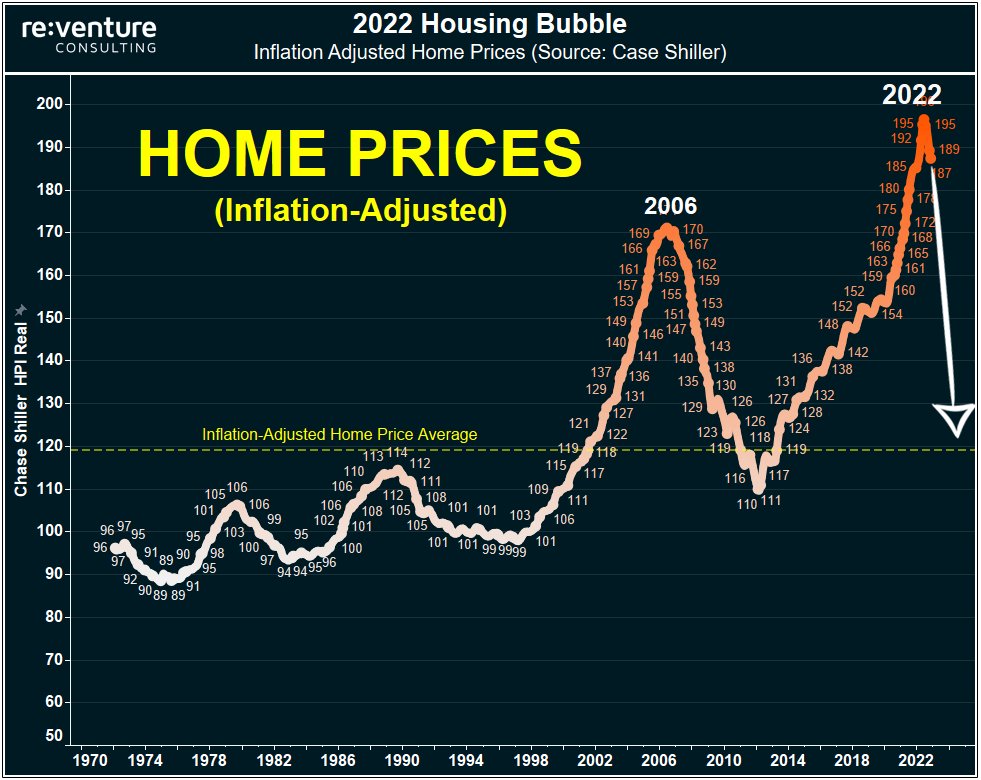
And remember folks: despite recent price decline, we're still in the BIGGEST BUBBLE EVER in Housing.
Inflation-adjusted home prices STILL above 2006 Levels.
(Funny how similar this graph looks to the Realtor graph)
Inflation-adjusted home prices STILL above 2006 Levels.
(Funny how similar this graph looks to the Realtor graph)
• • •
Missing some Tweet in this thread? You can try to
force a refresh