
CEO of Reventure App.
Home price forecasts and valuation rates for every ZIP code in the U.S.
 1) Let's start with today's NAR Pending Sales report, measuring contract signings for June 2026.
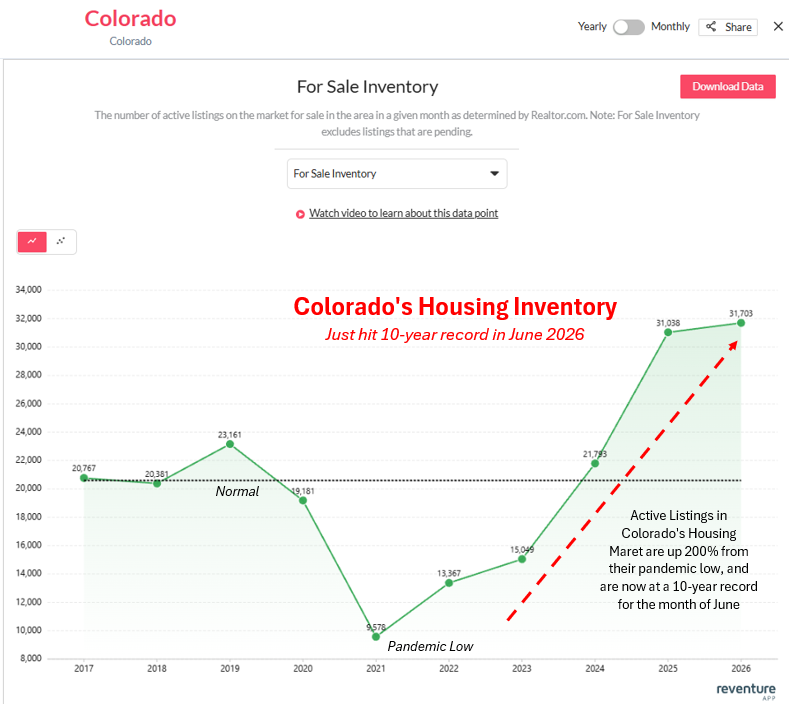 1) Colorado's housing supply glut is now third biggest in the U.S., even higher than Texas and Florida.
 1) Some corners of the real estate industry are talking about a potential "recovery" in Florida's housing market in 2026.
 1) I think it's important to pay attention to the long-term trends with these sales reports, because certain corners of the real estate industry are trying to turn a 3% MoM or YoY gain into a sign of meaningful recovery in the market.
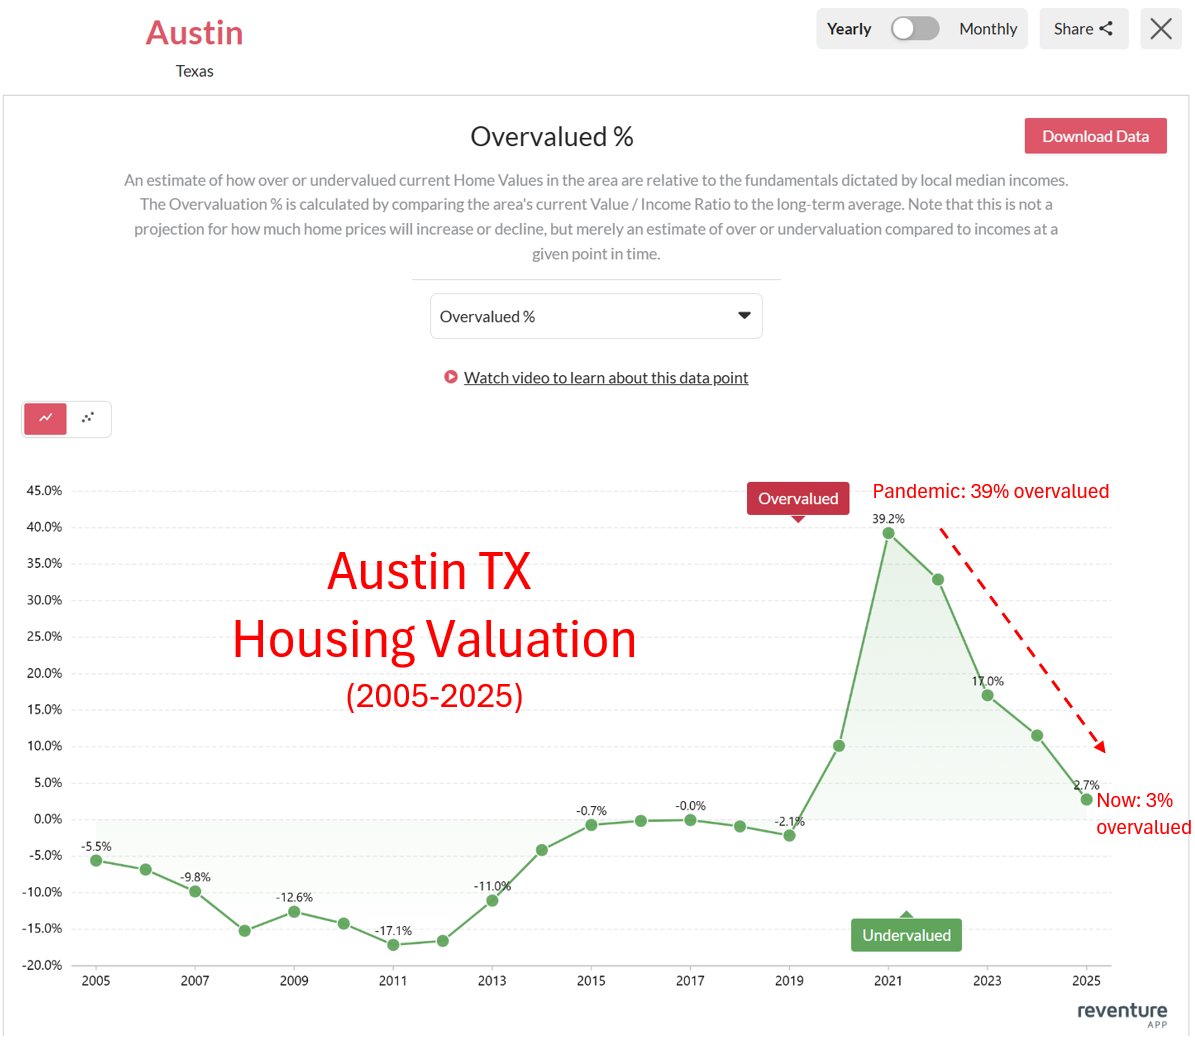
 1) The situation in Austin is a clear case of a classic "boom-bust" real estate cycle.
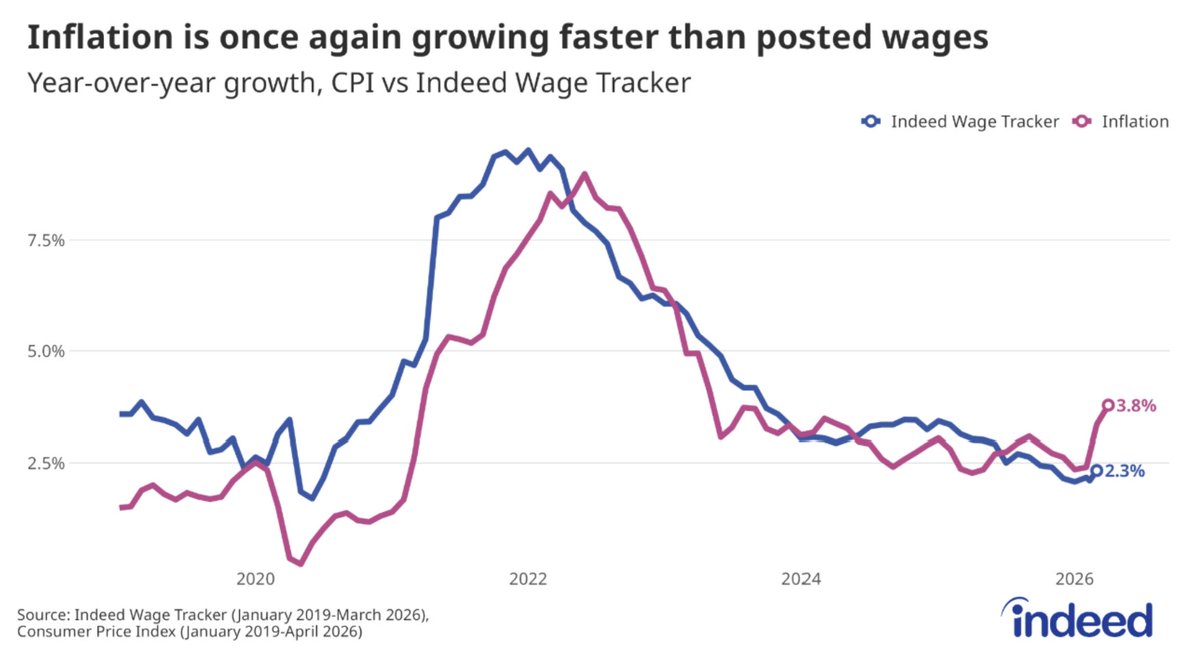 1) And this is very important to understand for the housing market, because in real estate, there are only two types of inflation that actually matter:
 1) While Seattle's days on market and months of supply are still tighter than most other markets, what matters most here is how Seattle's market is trending compared to its own history.
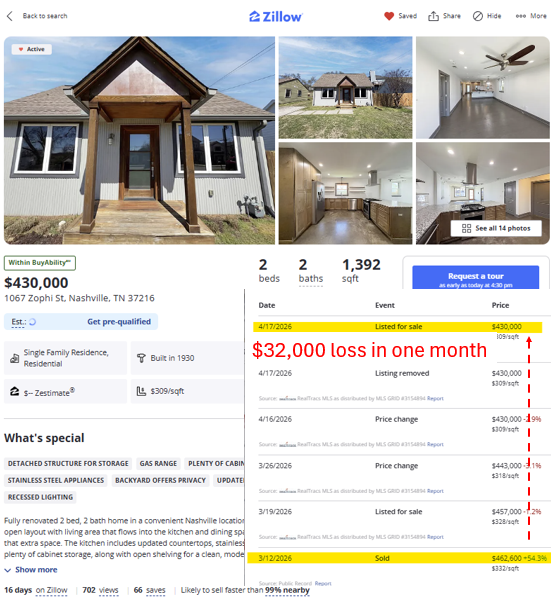 1) Opendoor's models can sometimes produce strange results, however I've never seen them take a $32,000 loss in a month.
  1) This Mortgage Application Purchase data, sourced from the MBA (Mortgage Bankers Association), is a real-time indicator of buyer demand.
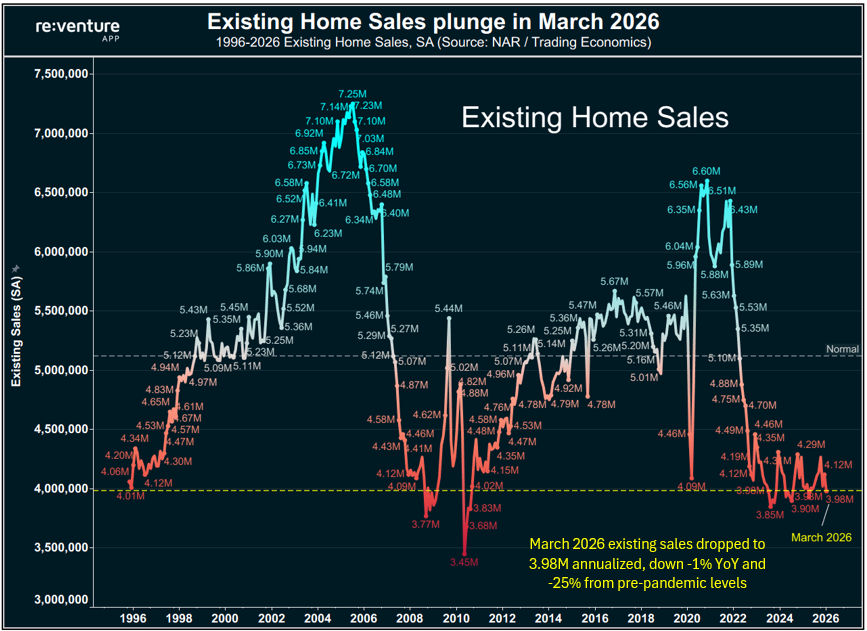 1) A lot of people seem to think the housing market is "doing just fine".
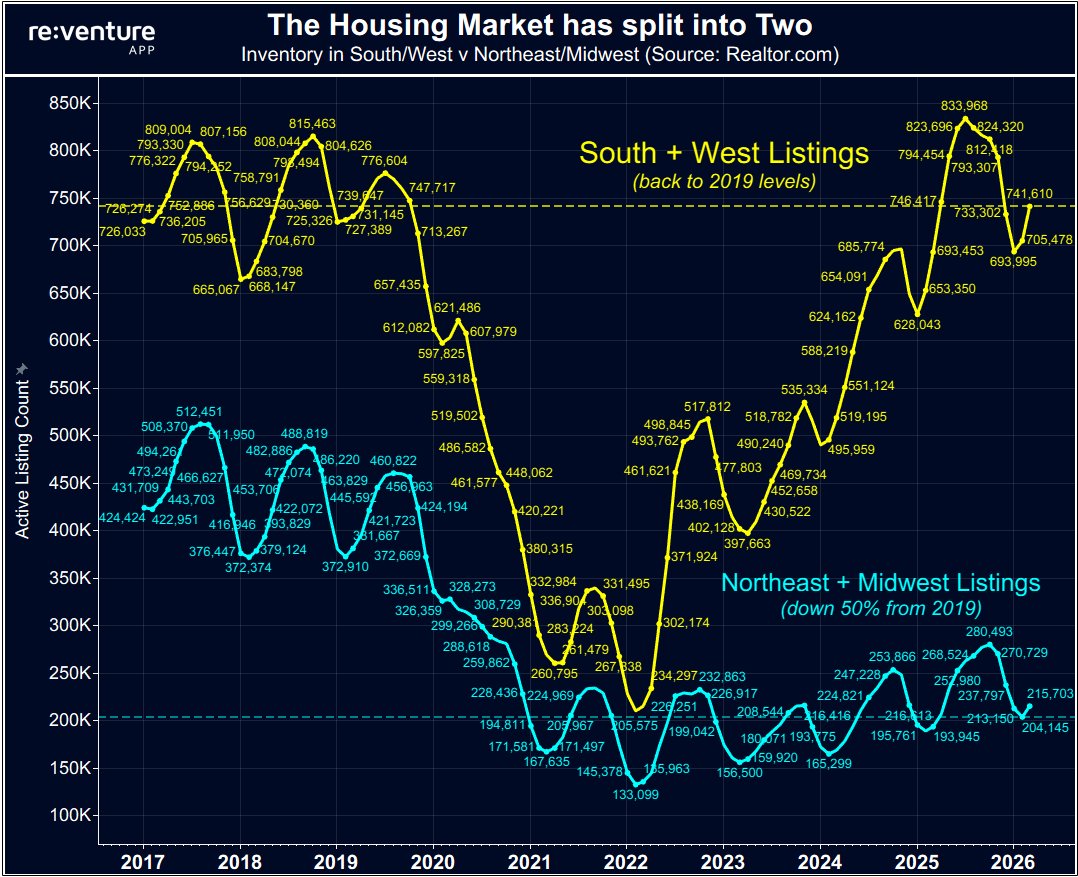 1) I still people floating around this idea of a "national housing shortage", and that couldn't be further from the truth at this point.
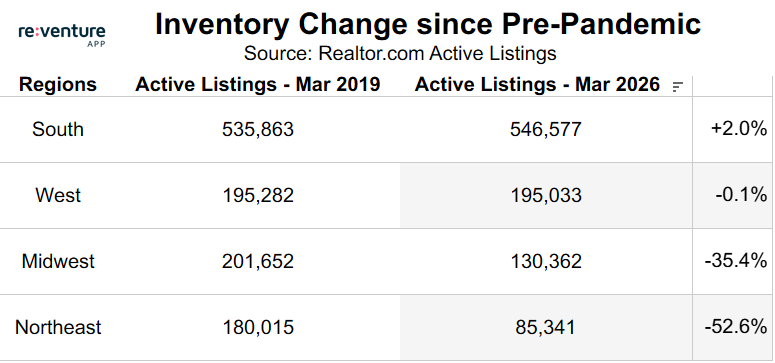
 1) The reason is very simple.
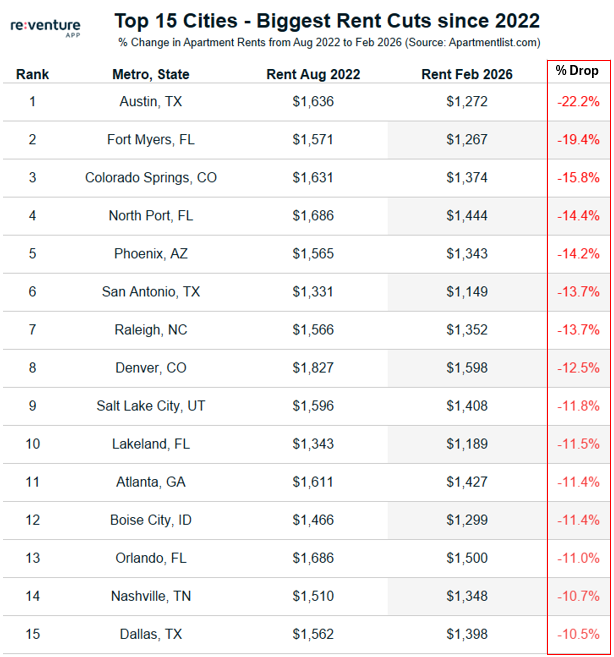 1) This data is sourced from Apartmentlist's median rent index, and proves how much of the U.S. Housing Market is in a deflationary environment in 2026.
 1) I like looking at a local area's rental market as an additional bellwether of where things are heading.
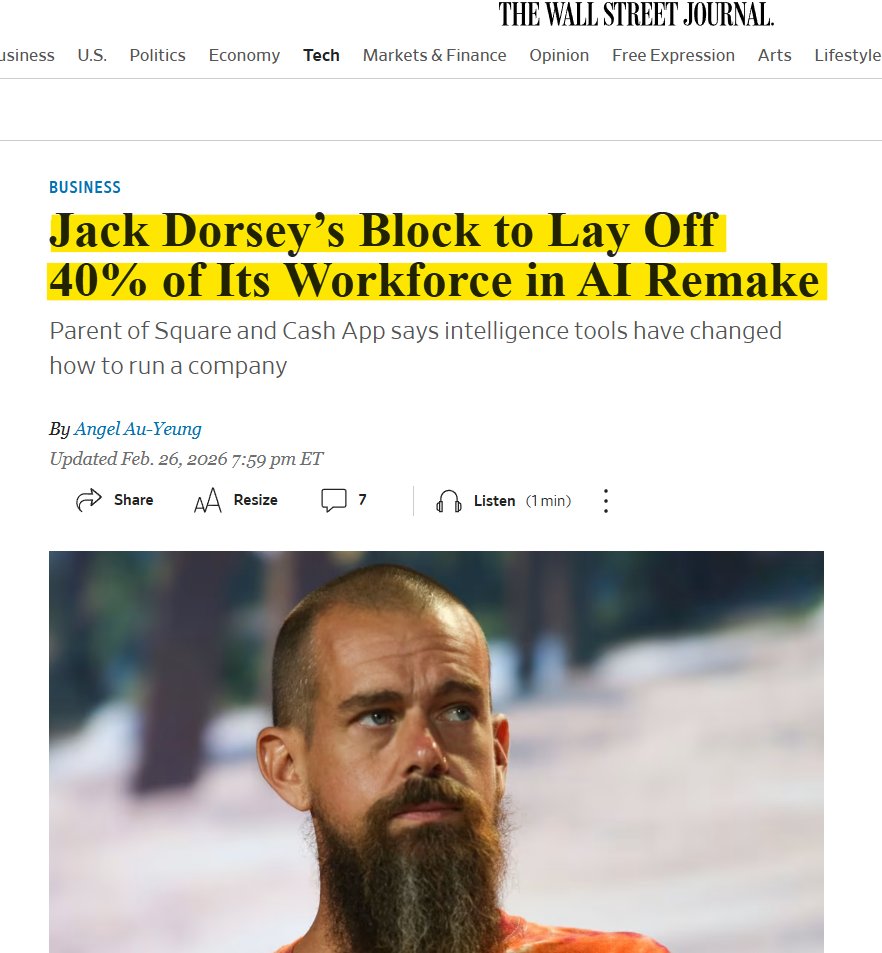 1) For those that don't know - Block, formerly Square, is a payment processing company founded by Jack Dorsey, who also co-founded Twitter.
 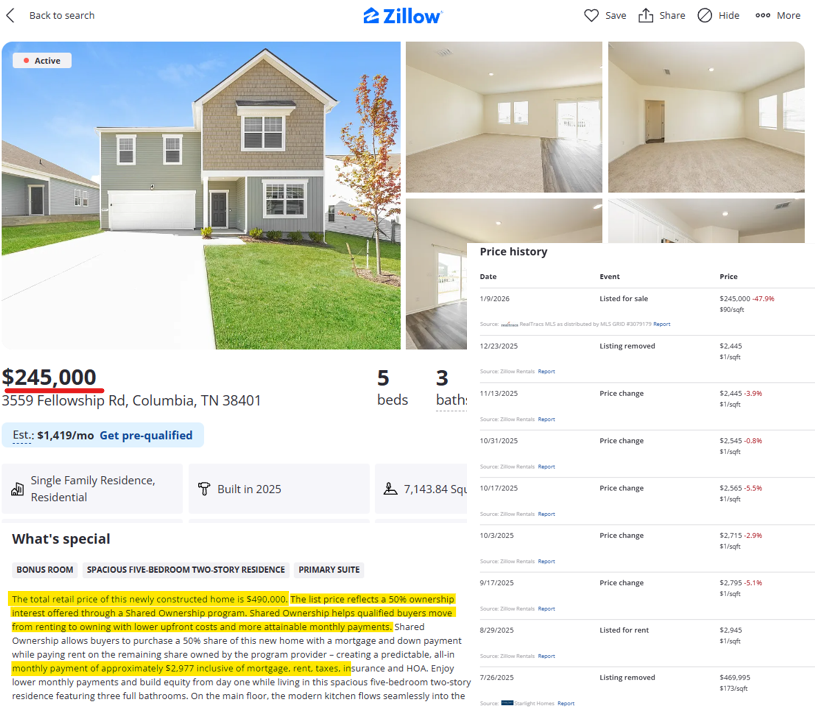 1) Interestingly, I toured this site last weekend when I was filming for my YouTube Channel.
 1) Colorado now relies almost exclusively on international migration to drive the bus on remaining population growth.
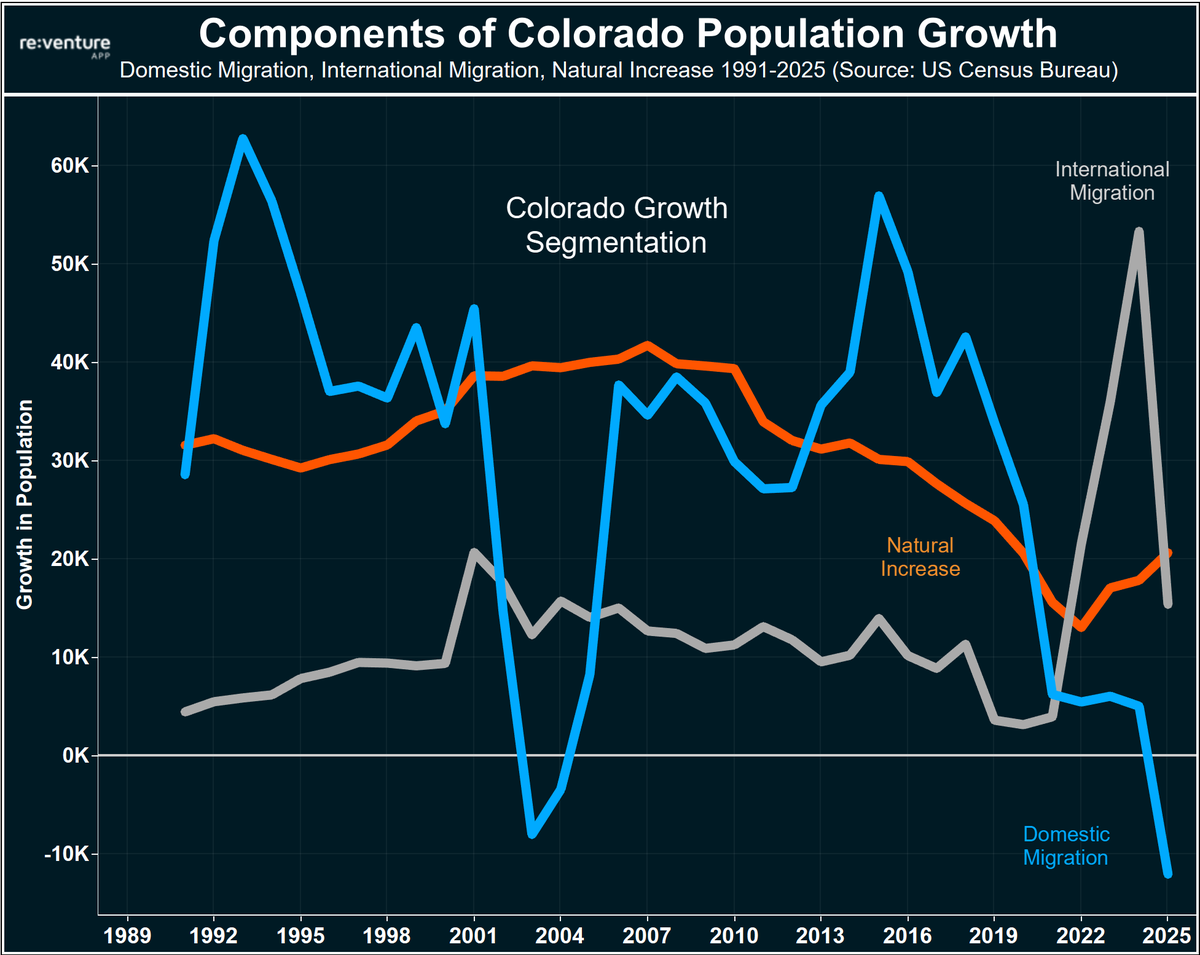
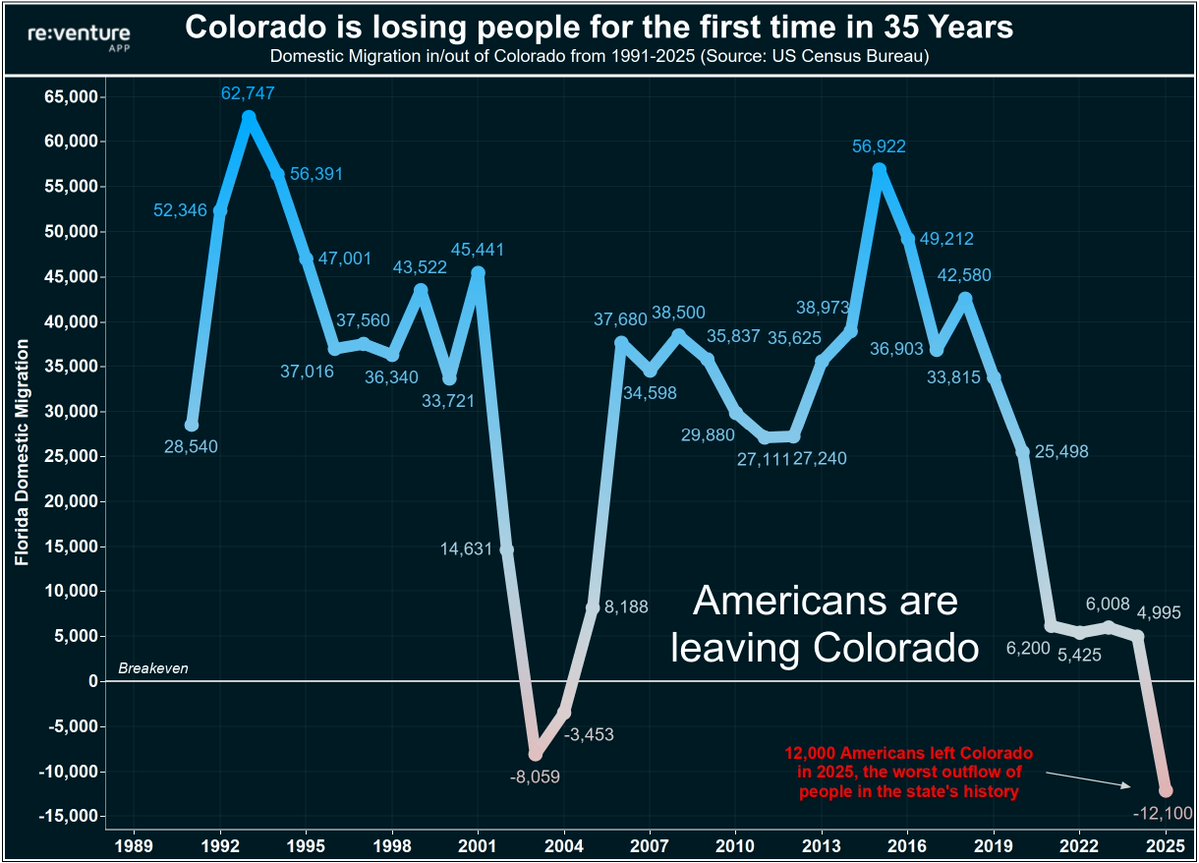
 1) Here's the math on the graph from above:
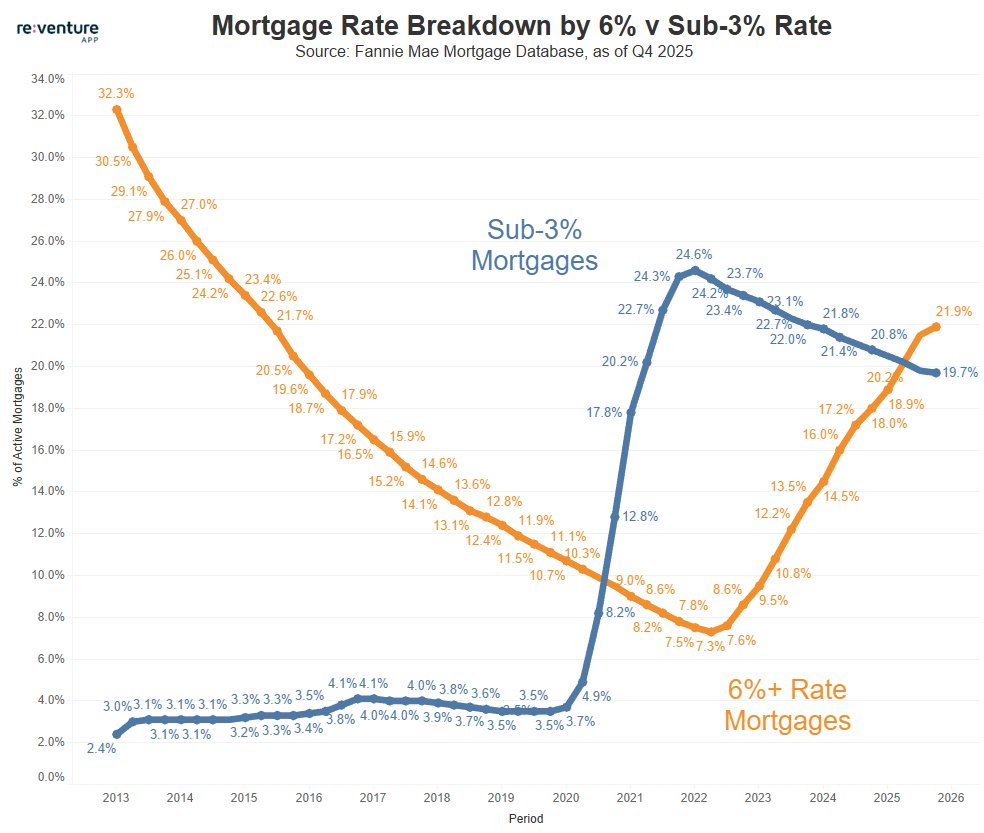
 1) I'd like to remind everyone that we've now had 7 rate cuts since August 2024.
 1) condos are an interesting asset class, because if you are in the wrong building, at the wrong time, the declines in value can be immense.
  1) A different way to view this data is by comparison today's rents to pre-pandemic.