Momentum Cash Trading Strategy
A thread🧵
Retweet and Share !
A thread🧵
Retweet and Share !
What is momentum trading ?
Momentum investing is a trading strategy in which Traders buy stocks at high price and sell even at higher price .
The goal is buying opportunities in short-term uptrends and then sell when the Stock starts to lose momentum.
2/n
Momentum investing is a trading strategy in which Traders buy stocks at high price and sell even at higher price .
The goal is buying opportunities in short-term uptrends and then sell when the Stock starts to lose momentum.
2/n
Skills Required:
Skilled traders understand when to enter into a position, how long to hold it for, and when to exit; they can also react to short-term, news-driven spikes or selloffs.
Risks of momentum trading include moving into a position too early, closing out too late
3/n
Skilled traders understand when to enter into a position, how long to hold it for, and when to exit; they can also react to short-term, news-driven spikes or selloffs.
Risks of momentum trading include moving into a position too early, closing out too late
3/n
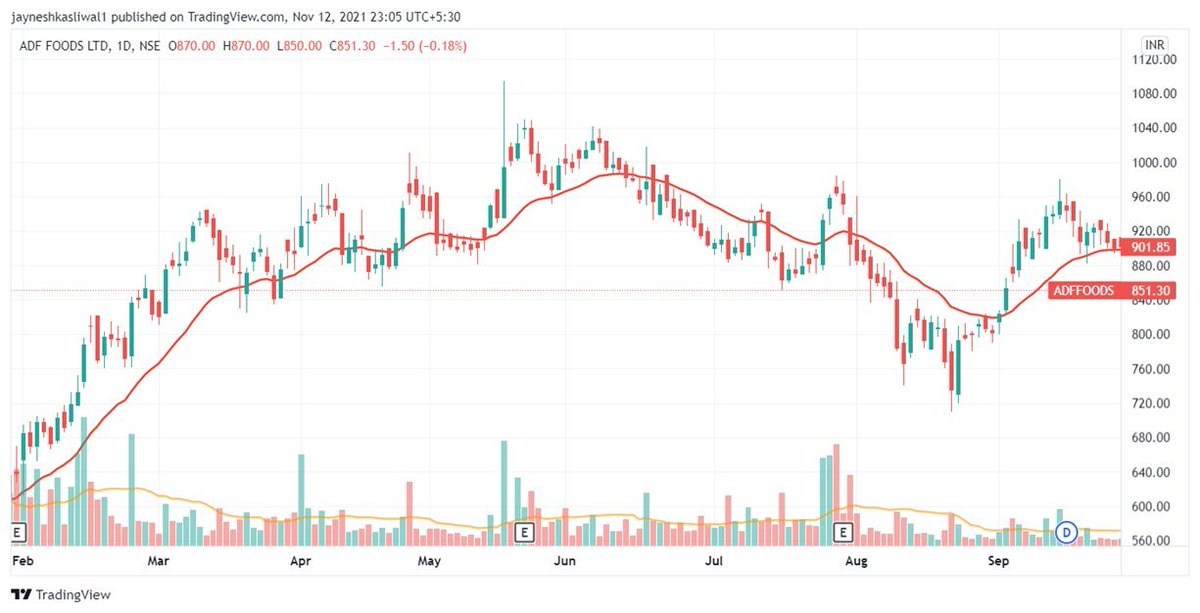
Identify the trend
Moving Averages Plot the Averge Price of a particular Period
Example :Whenever 21 ema is sloping upwards its called Shoterm uptrend
Whenever 21 ema is sloping downwards its called dowtrend
Whenever 21 ema is sideways its called consolidation
Refer image
4/n


Moving Averages Plot the Averge Price of a particular Period
Example :Whenever 21 ema is sloping upwards its called Shoterm uptrend
Whenever 21 ema is sloping downwards its called dowtrend
Whenever 21 ema is sideways its called consolidation
Refer image
4/n


Rules :
Use this simple trend following system to buy and sell stocks
Works well in trending market and trending stocks
Ideal place to sell a stock is its moved more than 15% away from 21 ema in 3 days
Risk increases the farther you buy from 21 ema
5/n
Use this simple trend following system to buy and sell stocks
Works well in trending market and trending stocks
Ideal place to sell a stock is its moved more than 15% away from 21 ema in 3 days
Risk increases the farther you buy from 21 ema
5/n

USING RELTAIVE STRENGTH
Type
“Relative Strength”
Choose any
By bharattrader
By traderlion
By Modhelius
I use by bharattrader
In setting use 65 period
6/n
More ABout RS + EMAs
:
Type
“Relative Strength”
Choose any
By bharattrader
By traderlion
By Modhelius
I use by bharattrader
In setting use 65 period
6/n
More ABout RS + EMAs
:
https://twitter.com/JayneshKasliwal/status/1484481492508049409?s=20&t=9hkMA8plCQJcWLWFAZIi9Q

Conditions of Relative Strength :
Relative Strength has a reference zero line
Line >0 Stock is Outperforming
Line <0 Stock is Underperforming
RS period 65 as we have around 65 trading days in 3 month
RS reference as Nifty50 as benchmark index
7/n
Relative Strength has a reference zero line
Line >0 Stock is Outperforming
Line <0 Stock is Underperforming
RS period 65 as we have around 65 trading days in 3 month
RS reference as Nifty50 as benchmark index
7/n
Stock Selection Criteria :
Stocks near 52 week High
Stocks near All time High
Stocks staying above 21 ema
Stocks where the Relative Strength Line is making new Highs
Stocks that are giving Volume Burst
Screener 1 : 4 year High Breakout Stocks chartink.com/screener/copy-…
8/n
Stocks near 52 week High
Stocks near All time High
Stocks staying above 21 ema
Stocks where the Relative Strength Line is making new Highs
Stocks that are giving Volume Burst
Screener 1 : 4 year High Breakout Stocks chartink.com/screener/copy-…
8/n
Buy Rules
Enter Stocks on Breakout of 52 Week High
Stock Should be in uprend and have HH HL formation for better Win rate
Volume Should be High on Breakout
Stock generally retest the breakout area hence add 50% position on breakout and 50% position on Retest
9/n
Enter Stocks on Breakout of 52 Week High
Stock Should be in uprend and have HH HL formation for better Win rate
Volume Should be High on Breakout
Stock generally retest the breakout area hence add 50% position on breakout and 50% position on Retest
9/n
Momentum is highest in RS+ Stocks where RS is increasing and is positive from long time
Momentum stays only for 2 to 3 days and then fades away or stock pulls back to breakout area to take support
Screener 2 : 52 week breakout Stocks chartink.com/screener/copy-…
10/n
Momentum stays only for 2 to 3 days and then fades away or stock pulls back to breakout area to take support
Screener 2 : 52 week breakout Stocks chartink.com/screener/copy-…
10/n
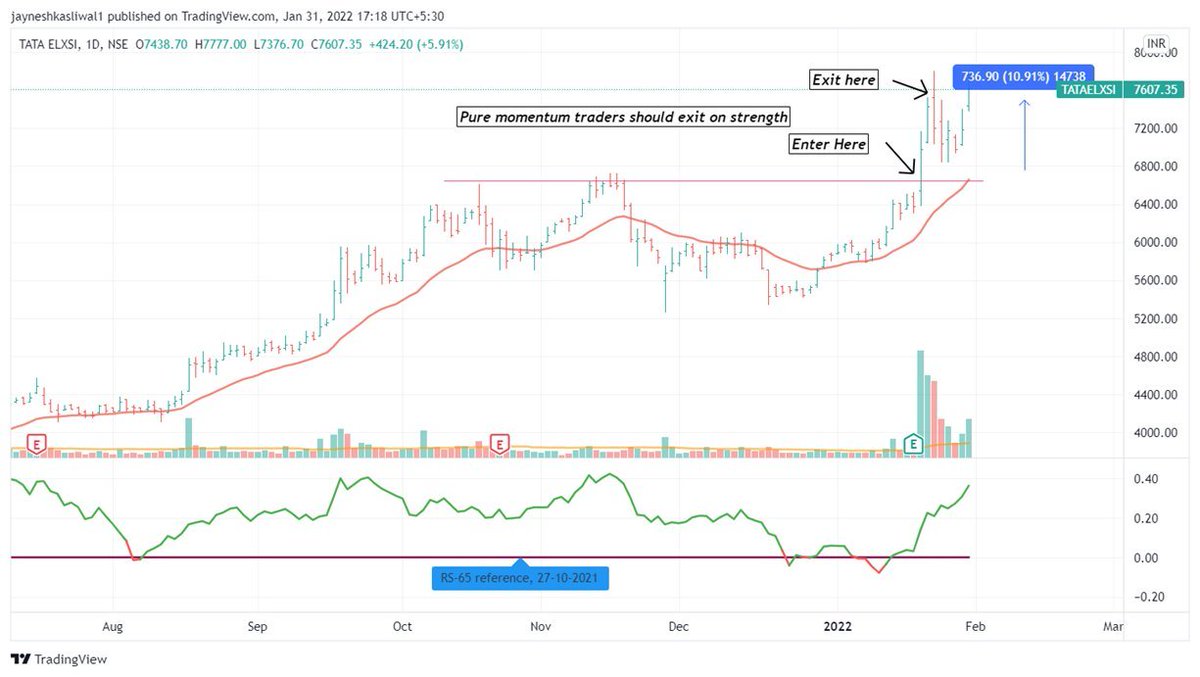
Hence main aim as momentum trader is to catch that quick movement in 2 to 3 days and get out before pullback
Selling as price goes up is important for momentum trading
One shouldn’t wait for price reversals otherwise you may loose all your gains
11/n
Selling as price goes up is important for momentum trading
One shouldn’t wait for price reversals otherwise you may loose all your gains
11/n
Momentum trading for a bigger time period :
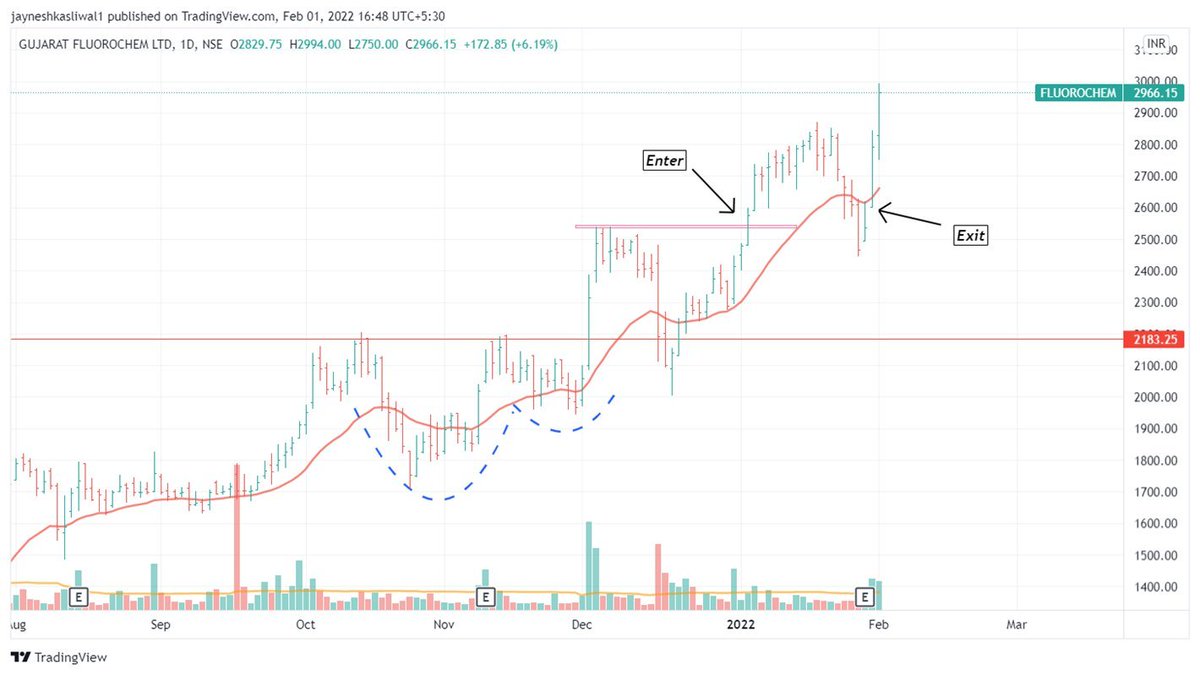
Keep holding stocks till it is above 21 ema
Exit as soon as stock breaks 21 ema even if RS is positive
Momentum fades a little when stock breaks 21 ema and now another stock should be picked
13/n


Keep holding stocks till it is above 21 ema
Exit as soon as stock breaks 21 ema even if RS is positive
Momentum fades a little when stock breaks 21 ema and now another stock should be picked
13/n



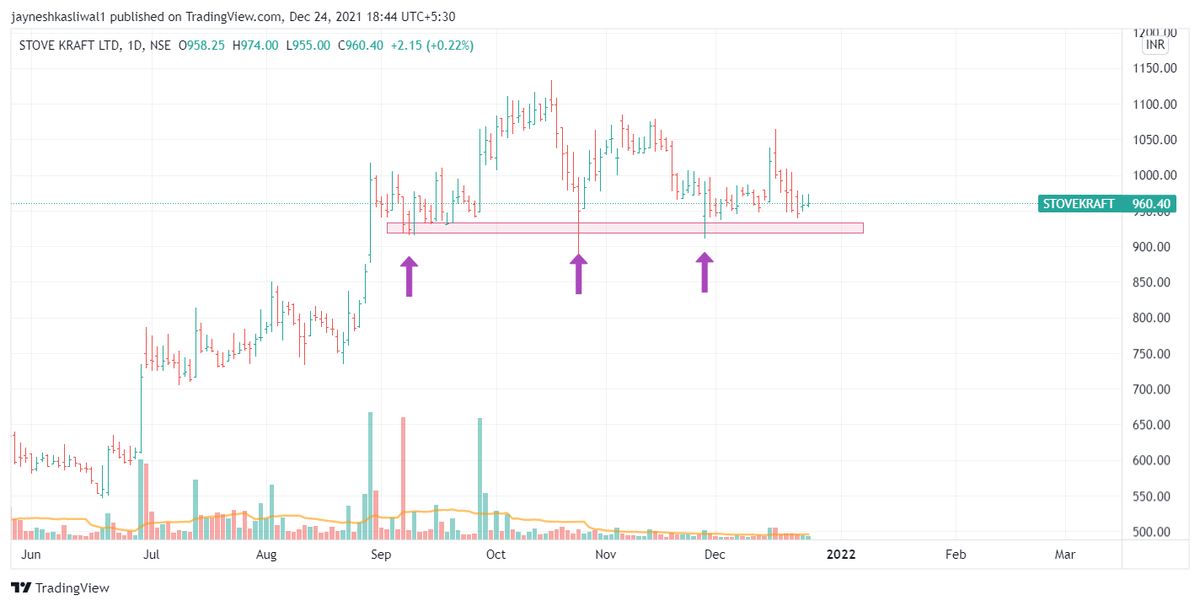
Loss Making Trades Example :
Keep Stoploss at Max 5 to 8%
Have Risk Reward Ratio of 1:2 Min
Youtube Video Of the Same Topic :
14/n
Keep Stoploss at Max 5 to 8%
Have Risk Reward Ratio of 1:2 Min
Youtube Video Of the Same Topic :
14/n
𝙎𝙬𝙞𝙣𝙜 𝙏𝙧𝙖𝙙𝙞𝙣𝙜 𝙈𝙚𝙣𝙩𝙤𝙧𝙨𝙝𝙞𝙥
To learn more about " How to Pick Stocks For 50-100% Returns "
Join our 4 Week Mentorship program with upto 10 Hours of Live Sessions !
Payment Link : rpy.club/g/rhZQwO97TG
You will be sent joining link to your WhatsApp
To learn more about " How to Pick Stocks For 50-100% Returns "
Join our 4 Week Mentorship program with upto 10 Hours of Live Sessions !
Payment Link : rpy.club/g/rhZQwO97TG
You will be sent joining link to your WhatsApp

" How to Pick Stocks For 50-100% Returns "
Week 1 : Basic of Swing Trading
Week 2 : Stage Analysis
Week 3 : Relative Strength
Week 4 : Swing Trading Techniques
Week 5 : Entry,Exit ,Position Sizing
Payment Link : rpy.club/g/rhZQwO97TG
Use Code :"NEWYEAR15" and get 500 Off
Week 1 : Basic of Swing Trading
Week 2 : Stage Analysis
Week 3 : Relative Strength
Week 4 : Swing Trading Techniques
Week 5 : Entry,Exit ,Position Sizing
Payment Link : rpy.club/g/rhZQwO97TG
Use Code :"NEWYEAR15" and get 500 Off
• • •
Missing some Tweet in this thread? You can try to
force a refresh


