ONS deaths data has been released for week ending 23 Dec.
2,982 more deaths were recorded in-week compared to the 2015-19 average. That’s 26% more, the largest excess we’ve seen all year.
Year-to-date there have been 567,379 deaths recorded which is 8% more than 2015-19 avg.
2,982 more deaths were recorded in-week compared to the 2015-19 average. That’s 26% more, the largest excess we’ve seen all year.
Year-to-date there have been 567,379 deaths recorded which is 8% more than 2015-19 avg.

There were 429 deaths in England and Wales this week where COVID was mentioned on the death certificate. The number of COVID deaths increased each week through December.
72% of deaths with COVID mentioned on the death certificate had it listed as underlying cause.
72% of deaths with COVID mentioned on the death certificate had it listed as underlying cause.
Deaths data was also released today for the previous week (ending 16 Dec).
This showed 1,639 more deaths compared to the 2015-19 average. That’s 15% more, also a bigger excess than we had been seeing.
This showed 1,639 more deaths compared to the 2015-19 average. That’s 15% more, also a bigger excess than we had been seeing.
The data ends just before Xmas so there’s no impact from Bank Hols. We know that COVID and flu were at high levels and there were severe delays in A&E. These are also weeks when nurses (15 and 20) and paramedics (21) were on strike (but note delay between death and registration).
Comparisons of death counts can be distorted by population growth and ageing.
The best way to compare deaths during the pandemic to prior years is to use age-standardised death rates.
The CMI Mortality Monitor takes this approach. Their next update is expected later today.
The best way to compare deaths during the pandemic to prior years is to use age-standardised death rates.
The CMI Mortality Monitor takes this approach. Their next update is expected later today.
The CMI age-standardised mortality analysis is now available and shows death rates 18% higher than pre-pandemic this week.
https://twitter.com/covid19actuary/status/1611039482077401088
More discussion of the issues here👇
https://twitter.com/actuarybyday/status/1611270026459217927
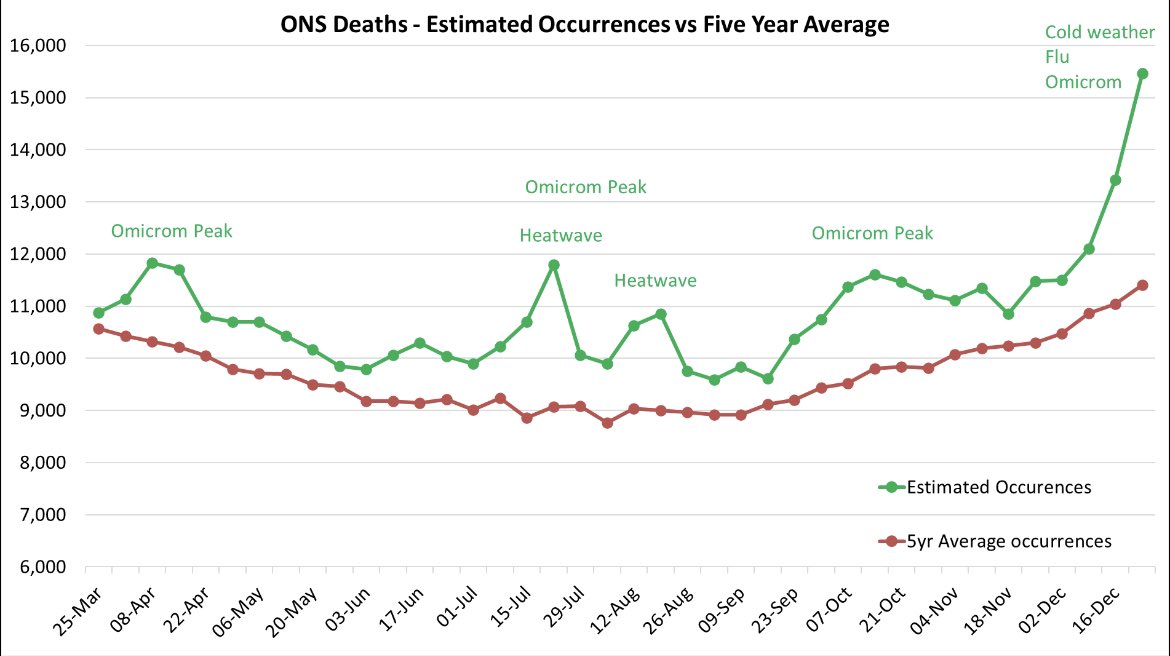
Here’s how yesterday’s ONS deaths data look when we consider (modelled) date of death rather than date the death was registered.
I’ve marked up acute factors on the chart but chronic factors like NHS pressure are there throughout, contributing to continuous excess for 9 months.
I’ve marked up acute factors on the chart but chronic factors like NHS pressure are there throughout, contributing to continuous excess for 9 months.
Going to be kicking myself all day about “Omicrom” typo (and copy/pasting it repeatedly times”).
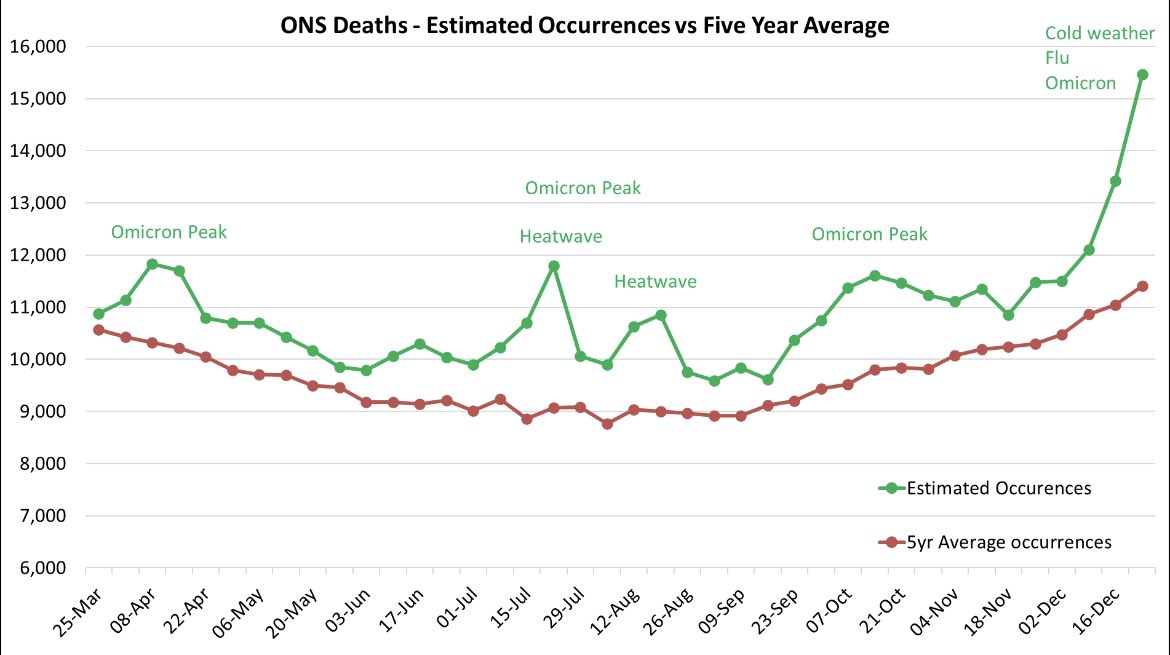
Here’s a typo free version (I hope) for anyone who wishes to share it.
Here’s a typo free version (I hope) for anyone who wishes to share it.
• • •
Missing some Tweet in this thread? You can try to
force a refresh